- The normal way to think of an image is in the spatial domain where an image is as a rectangular array of pixels. Each image pixel represents an intensity at a position in space. In the spatial domain tools that manipulate image intensity like levels, curves, and color adjustment are all simple to use since the image is expressed as intensity levels. But some operations are complicated or impossible to perform in the spatial domain and require a different way of expressing an image. If an image is thought of as a sum of sinusoidal waves then the image can be represented in a different way known as the frequency domain. In the frequency domain smooth and sharpen operations are simplified and operations on periodic structure are possible.
- The Fourier transform is used to express an image in the spatial intensity domain as a sum of sine waves in the frequency domain. The spectrum consists of the frequency amplitudes of the sin waves that represent the image. The frequency spectrum image is symmetric about its center. The lowest or zero frequency wave amplitude found in an image is located at the center of the frequency spectrum image. Frequency increases from low to high as you move from the center to the corner of the spectrum image.
A good way to gain an understanding of the spectrum of an image is to study simple images. So let's start with the spectrum of a constant image.
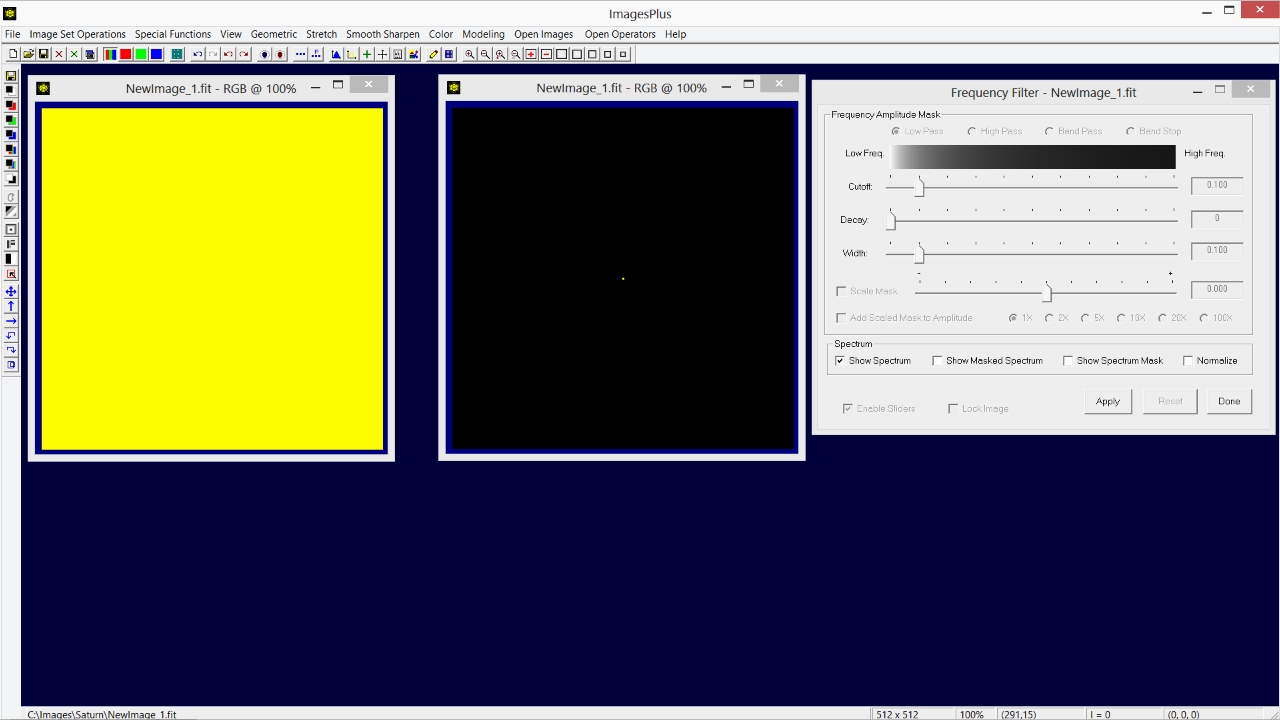
A constant yellow image is shown on the left with its frequency spectrum image on the right. The frequency spectrum image was created by applying the Smooth Sharpen | Frequency Filter tool with the Show Spectrum box checked to a copy of the constant yellow image. The yellow dot in the center of the spectrum is the amplitude of the zero frequency wave or direct current (DC) of the constant yellow image and is the average color of the image. The color you should get if you completely blur, average, or resize the image down to a single pixel or color. Another way of thinking about the special DC pixel at the center of the spectrum image is that it represents the center bias color that all the other sine waves modify.
 |
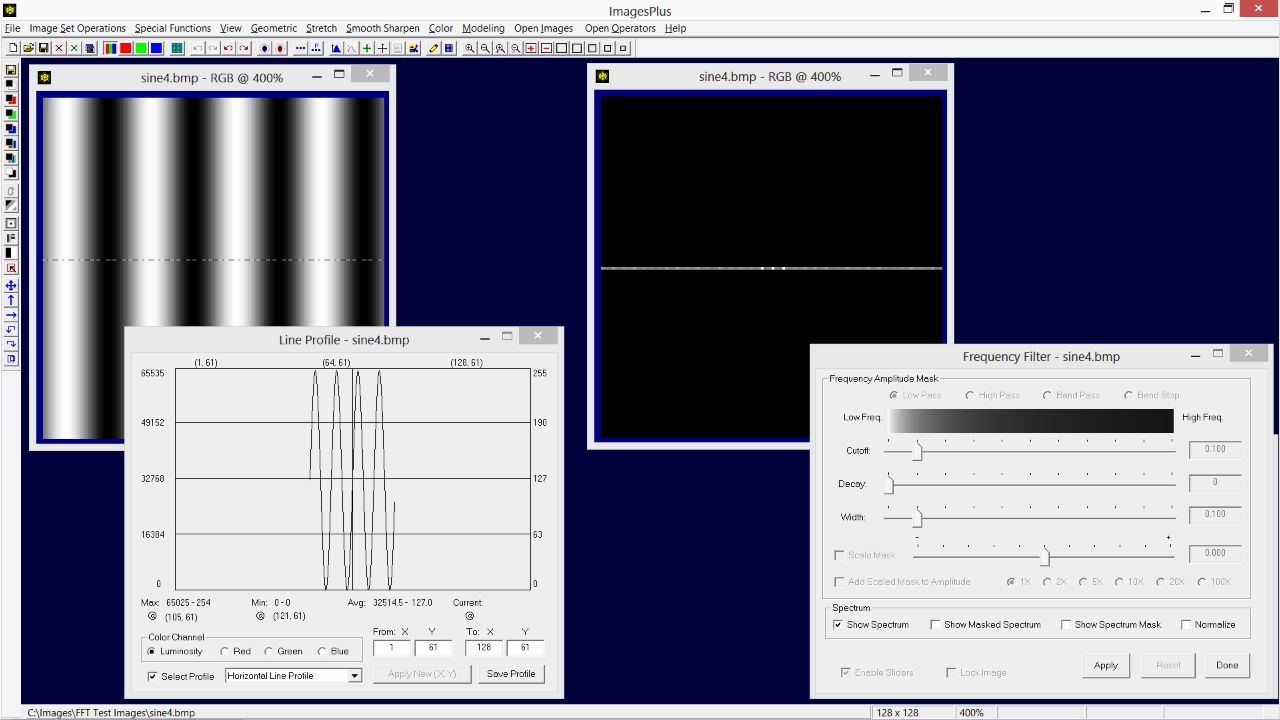
Next, let's look at the spectrum of an image with a single horizontal sine wave of frequency 4 shown on the left with its frequency spectrum image on the right.
The Frequency Filter with Show Spectrum option checked displays the frequency amplitudes of the sine wave decomposition with respect to the width and height of the image. A horizontal line profile shown on the left shows the sine wave with frequency 4. A vertical line profile is always a constant line with zero frequency. As a result the frequency spectrum of the sine wave image is a horizontal line.
The bright pixel at the center of the spectrum image is as before the DC value or average color. Four pixels to the left and right of the bright center DC pixel are two bright pixels which are the amplitude of the sine wave of frequency 4 found in the image. Since the frequency of the sine wave across the width of the image is exactly 4 cycles the two bright frequency pixels are exactly 4 pixels away from the center DC pixel. A perfect smooth continuous sine wave would have just the 3 bright pixels. But the sine wave displayed by the image is discrete because of the finite number of possible gray values. As a result harmonic frequency amplitudes appear as dimmer pixels in the spectrum image along a horizontal line through the DC pixel and two bright frequency 4 pixels. But why two bright pixels one on each side of the center DC pixel? A sine wave can be described in two ways, one with a negative direction and phase and the other with positive direction and phase. Both descriptions are mathematically correct and a Fourier transform does not distinguish between them. This is why the spectrum is symmetric about the center DC pixel.
 |
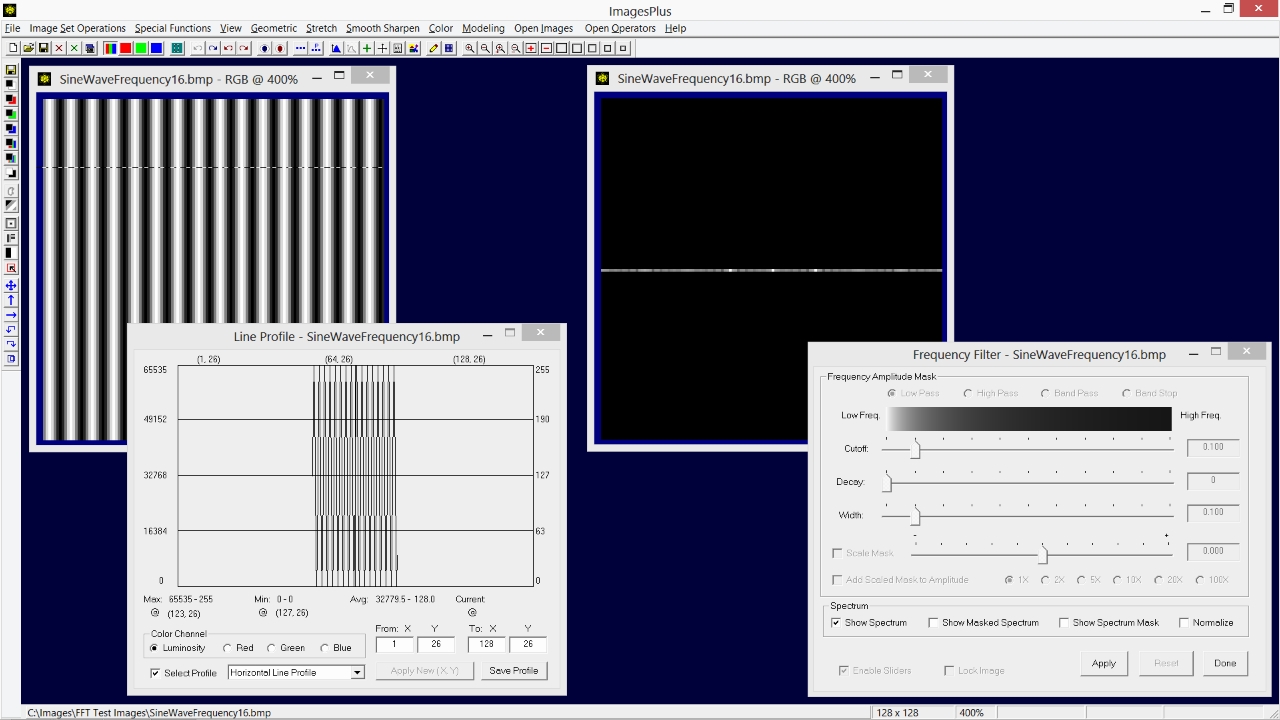
A horizontal sine wave with 16 cycles shown on left again shows 3 bright pixels in its spectrum image on right but the bright pixels are further apart. In this case the two bright pixels are spaced 16 pixels to the left and right side of the bright center DC pixel. Comparing the spectrum of the frequency 4 sine wave with the frequency 16 sine wave you can see that sine waves are represented by two bright pixels in the appropriate spectrum position. The distance this position is from the center DC value determine the frequency of the sine wave. The smaller the wave length the higher the frequency, so the further the two bright pixels will be from the center DC pixel. If the width of the image is divided by the frequency or distance of the two bright pixels from the center DC pixel you will get the wavelength or distance between peaks of the sin wave contained in the image. In the above example the image width of 128 pixels is divided by 16 cycles to yield a wavelength of 8 pixels between each vertical band.
 |
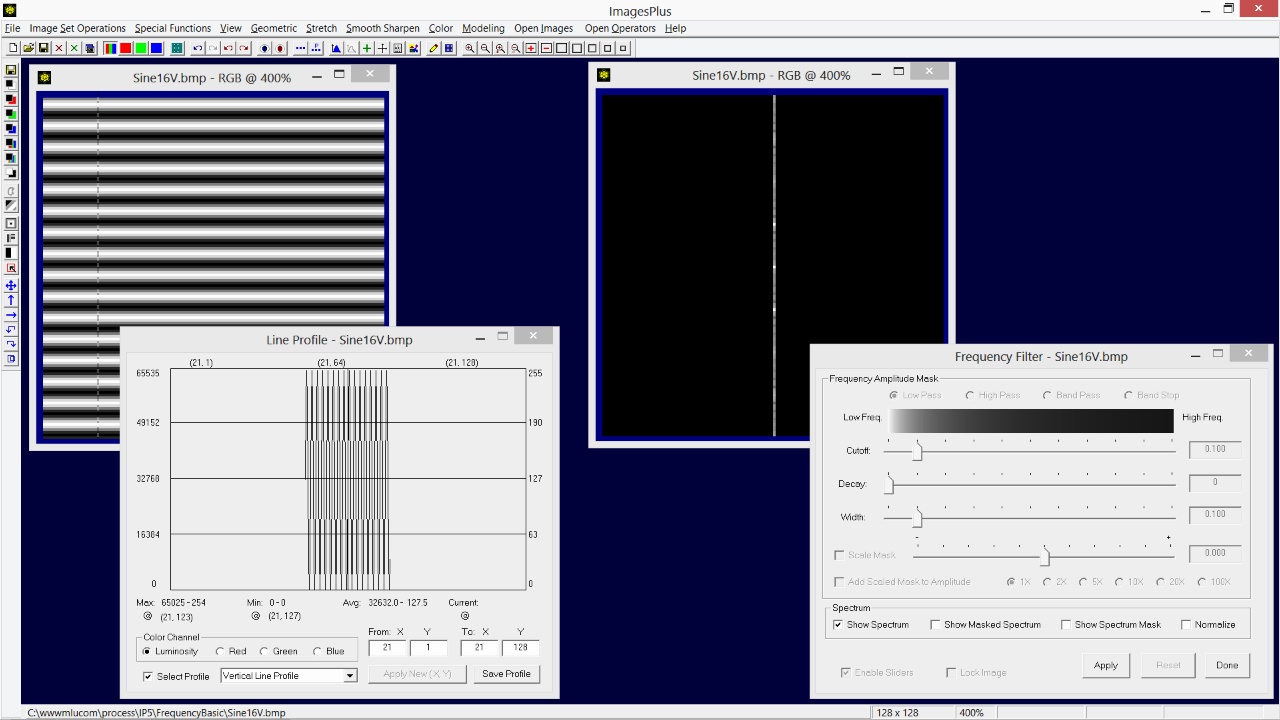
If the horizontal sine wave image with frequency 16 is rotated 90 degrees then the two bright pixels are above and below the center bright DC pixel. In this case a vertical line profile shown on the left shows the sine wave with frequency 16. A horizontal line profile is always a constant line with zero frequency. As a result the frequency spectrum of the vertical sine wave image is a vertical line containing the 2 bright frequency 16 pixels. This also shows the symmetric nature of the frequency spectrum image.
 |
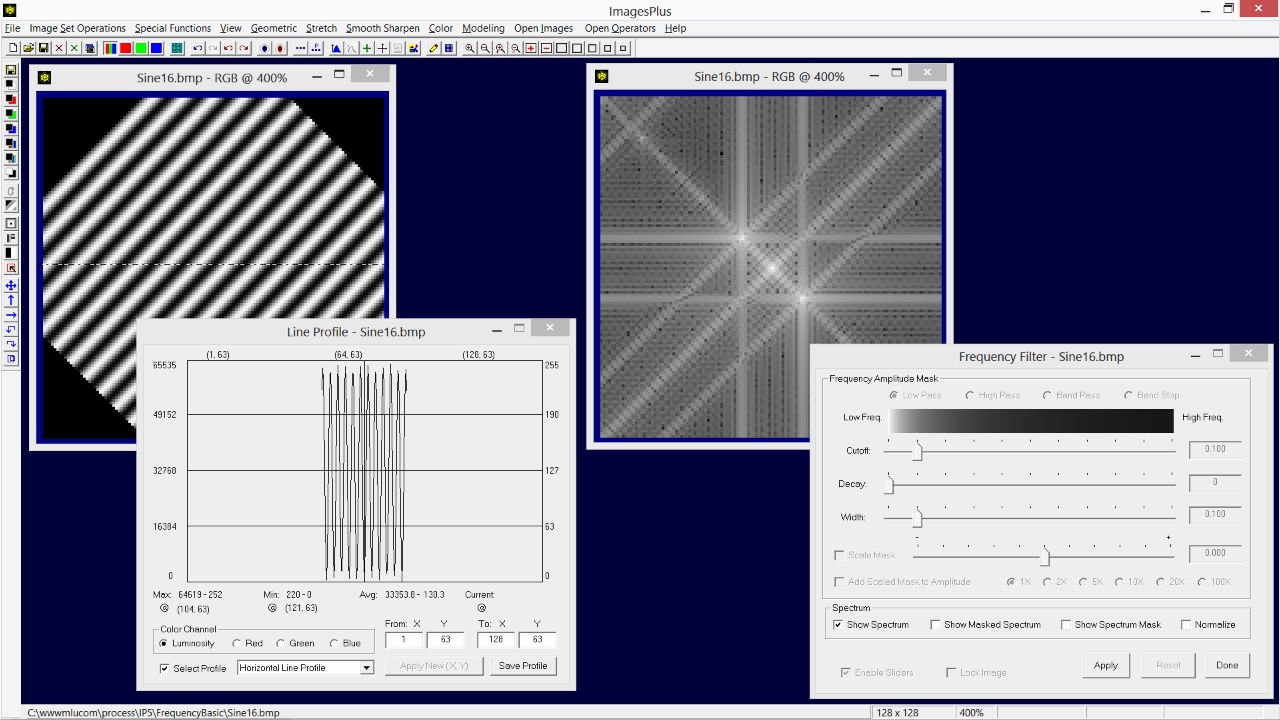
If the horizontal sine wave image with frequency 16 is rotated 45 degrees then the two bright pixels are on a 45 degree line through the center bright DC pixel. But now both a horizontal and vertical line profile show a sine wave of frequency 11. Since spectrum frequency amplitudes are computed and displayed with respect to the width and height the spectrum is a blend of the horizontal and vertical sine waves of frequency 11. The two bright pixels on the 45 degree line through the center DC pixel are now 11 pixels from the center of the spectrum. This example and the two previous examples show that for a given sine wave with vertical and horizontal frequency F the main frequency amplitudes of the wave are located on a ring of radius F about the center of the spectrum. The position of the two bright frequency pixels on the ring depends on the orientation of the sine wave.
As we will see below modifying a symmetric ring of frequency amplitudes about the center of the spectrum is the key to modifying an image spectrum to perform smooth, sharpen, noise reduction, and mask creation.
 |
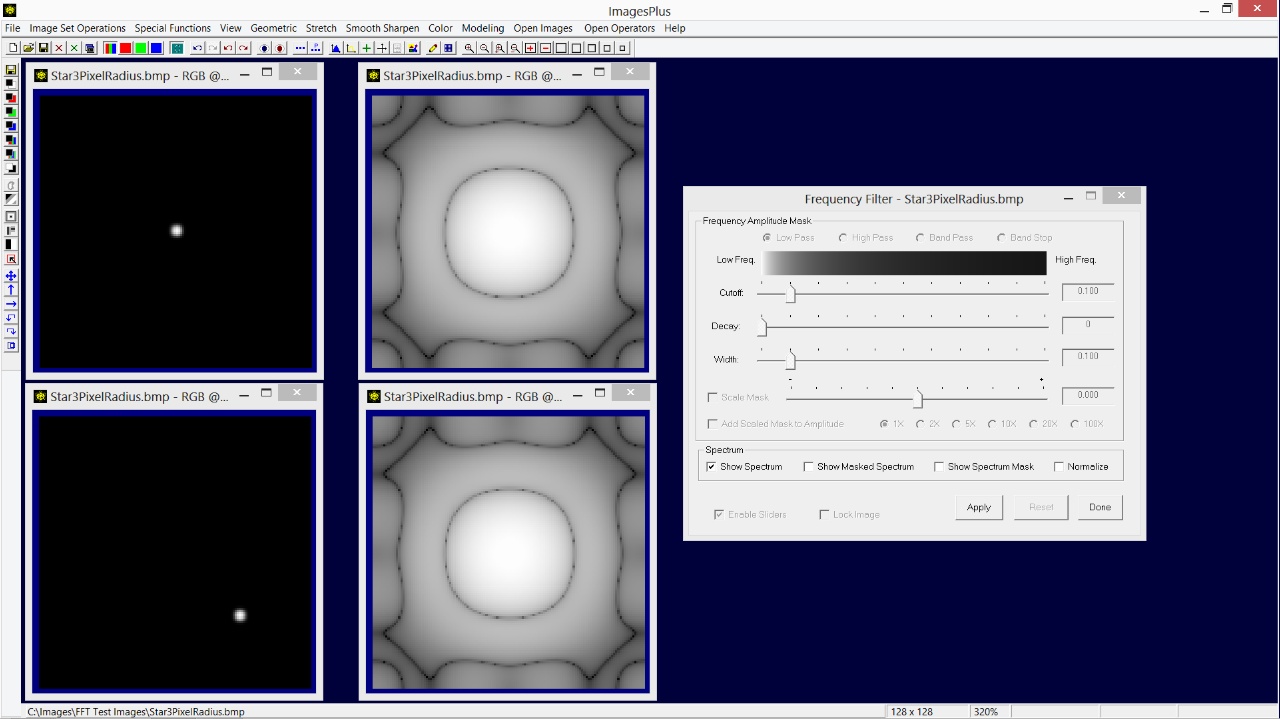
The spectrum of an artificial star of radius 3 is shown above. Below is the same star shifted to the lower right with its spectrum. Note that the spectrum does not change when the position of the star is shifted since the frequency spectrum only contains frequency amplitude information and not position information. The Fourier transform of the star image computed by the Frequency Filter actually computes a frequency amplitude spectrum and also a phase image that contains position information. Modification of the frequency amplitude spectrum is all that is required to smooth, sharpen, or create image masks. The phase image is not modified by the Frequency Filter so that the position of objects in the image remain fixed. However, different regions of an image can be isolated using an image or control point mask and used with the Frequency Filter.
 |
-
The above examples demonstrate the important properties of the frequency spectrum of an image and are as follows :
- The center DC pixel of the spectrum image is the average color of the image that you would get if all detail is removed.
- The frequency amplitude spectrum is symmetric about the center DC pixel. So the amplitudes of a given frequency F are contained in a ring of radius F about the center DC pixel.
- The frequency spectrum only contains frequency amplitudes and contains no position data.
As a result of these 3 properties modification of the frequency amplitude spectrum is all that is required to smooth, sharpen, create star masks, create object masks, and remove structured noise from an image. Let's look at how the Frequency Filter tool uses a circular ring mask of variable frequency cutoff position, decay, and width to alter the frequency spectrum of an image. The Frequency Amplitude Mask controls on the Frequency Filter control the shape of the center symmetric frequency amplitude ring mask.
The Low Pass frequency mask option uses or passes low frequency amplitudes of large scale objects such as a galaxy or nebula with little or no change while higher frequency amplitudes from smaller objects like stars and even smaller objects like noise are decreased producing a smoothing effect.
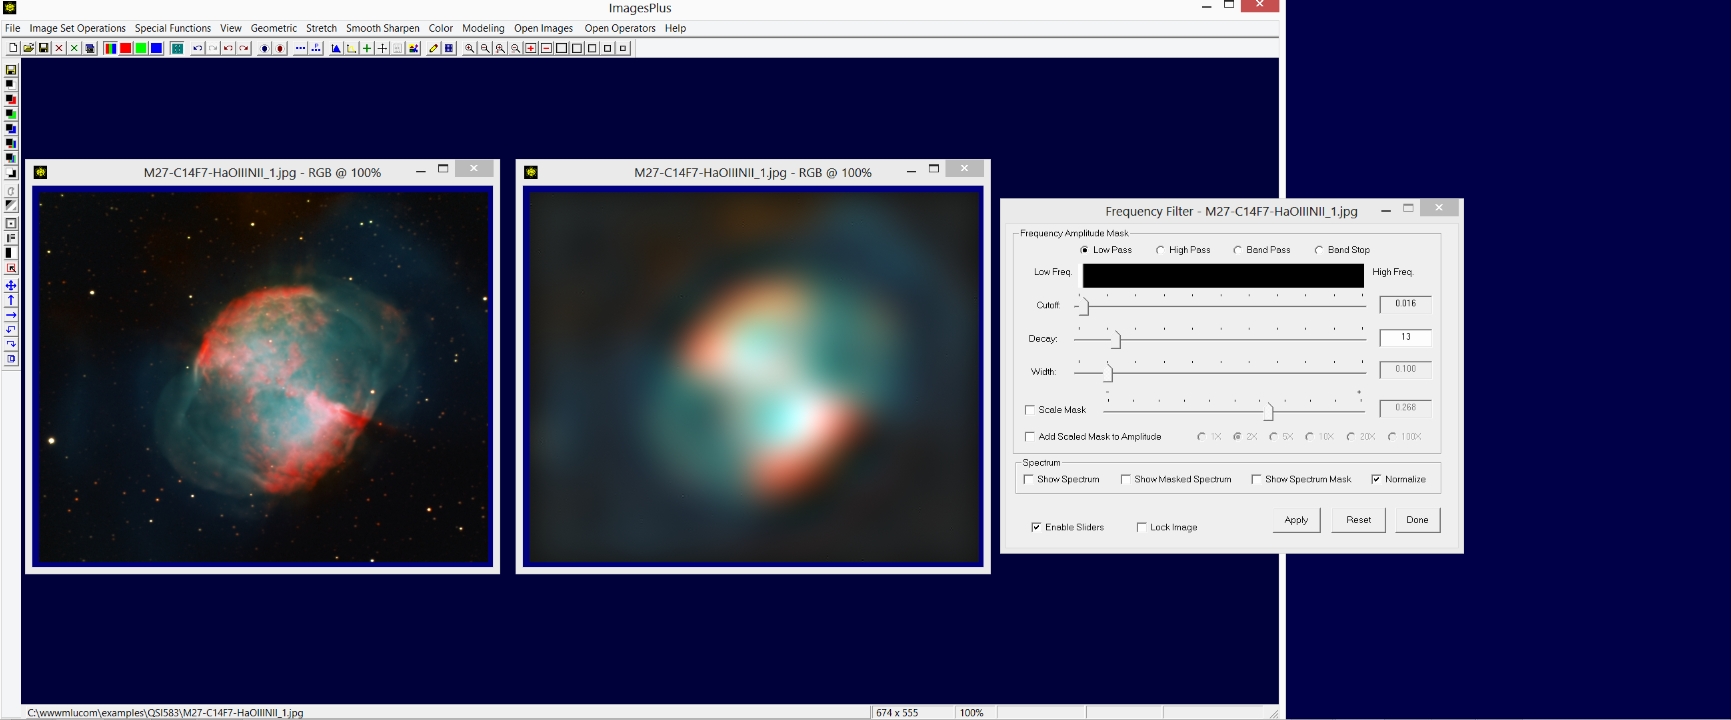
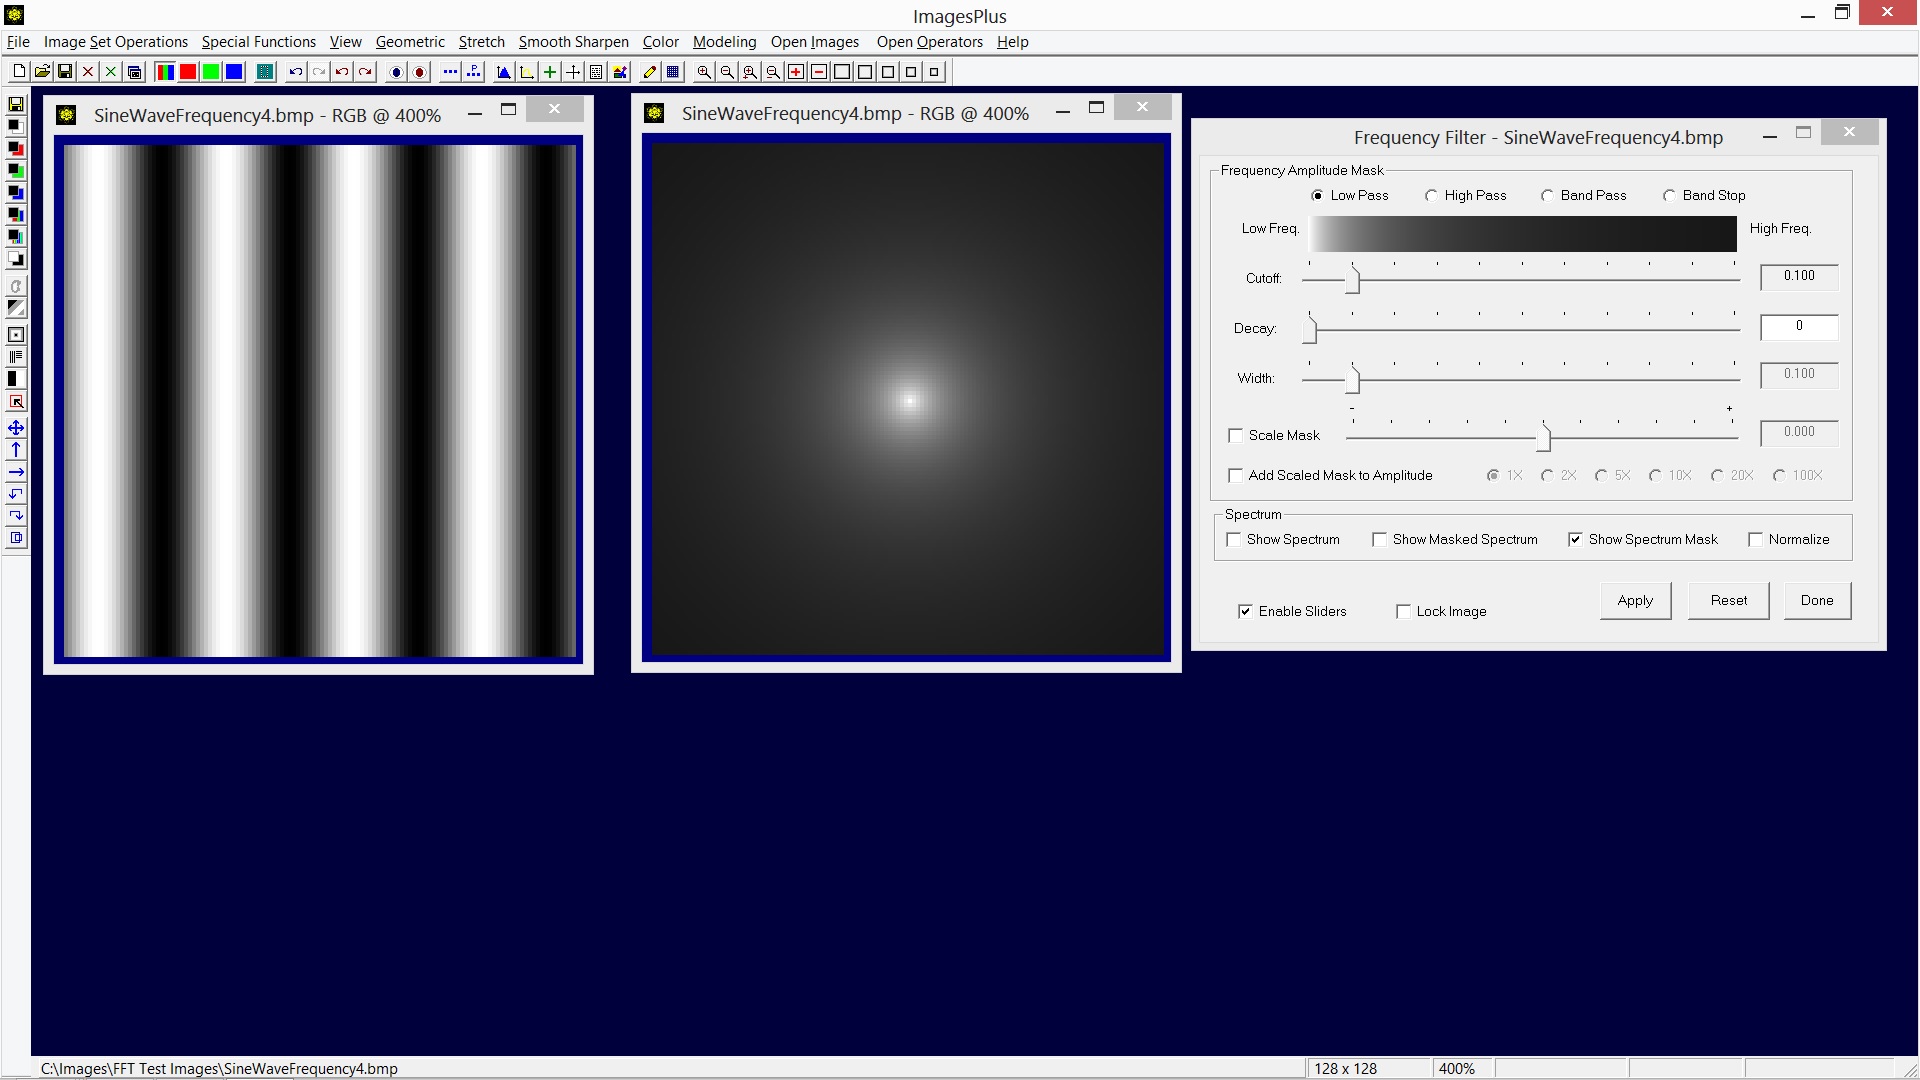
The Frequency Filter tool is shown above with the Low Pass option selected. The frequency amplitude mask is dispalyed since the Show Spectrum Mask option is checked. Vary the Cutoff slider to change the radius of frequency cutoff range. The Decay slider is used to vary the rate of change of the frequency amplitude mask from white to black about the cutoff setting. Remember with a mask white reveals and black conceals. So the low pass frequency amplitude mask is white in the center to reveal low frequencies unchanged. The low pass mask tapers off to gray or black as you move toward the corners of the spectrum to reduce high frequency object amplitude.
Note that the gray scale bar at the top of the Frequency Filter tool is a line profile from the center to the corner of the frequency mask that will be created by the cutoff, decay, and width parameters.
 |
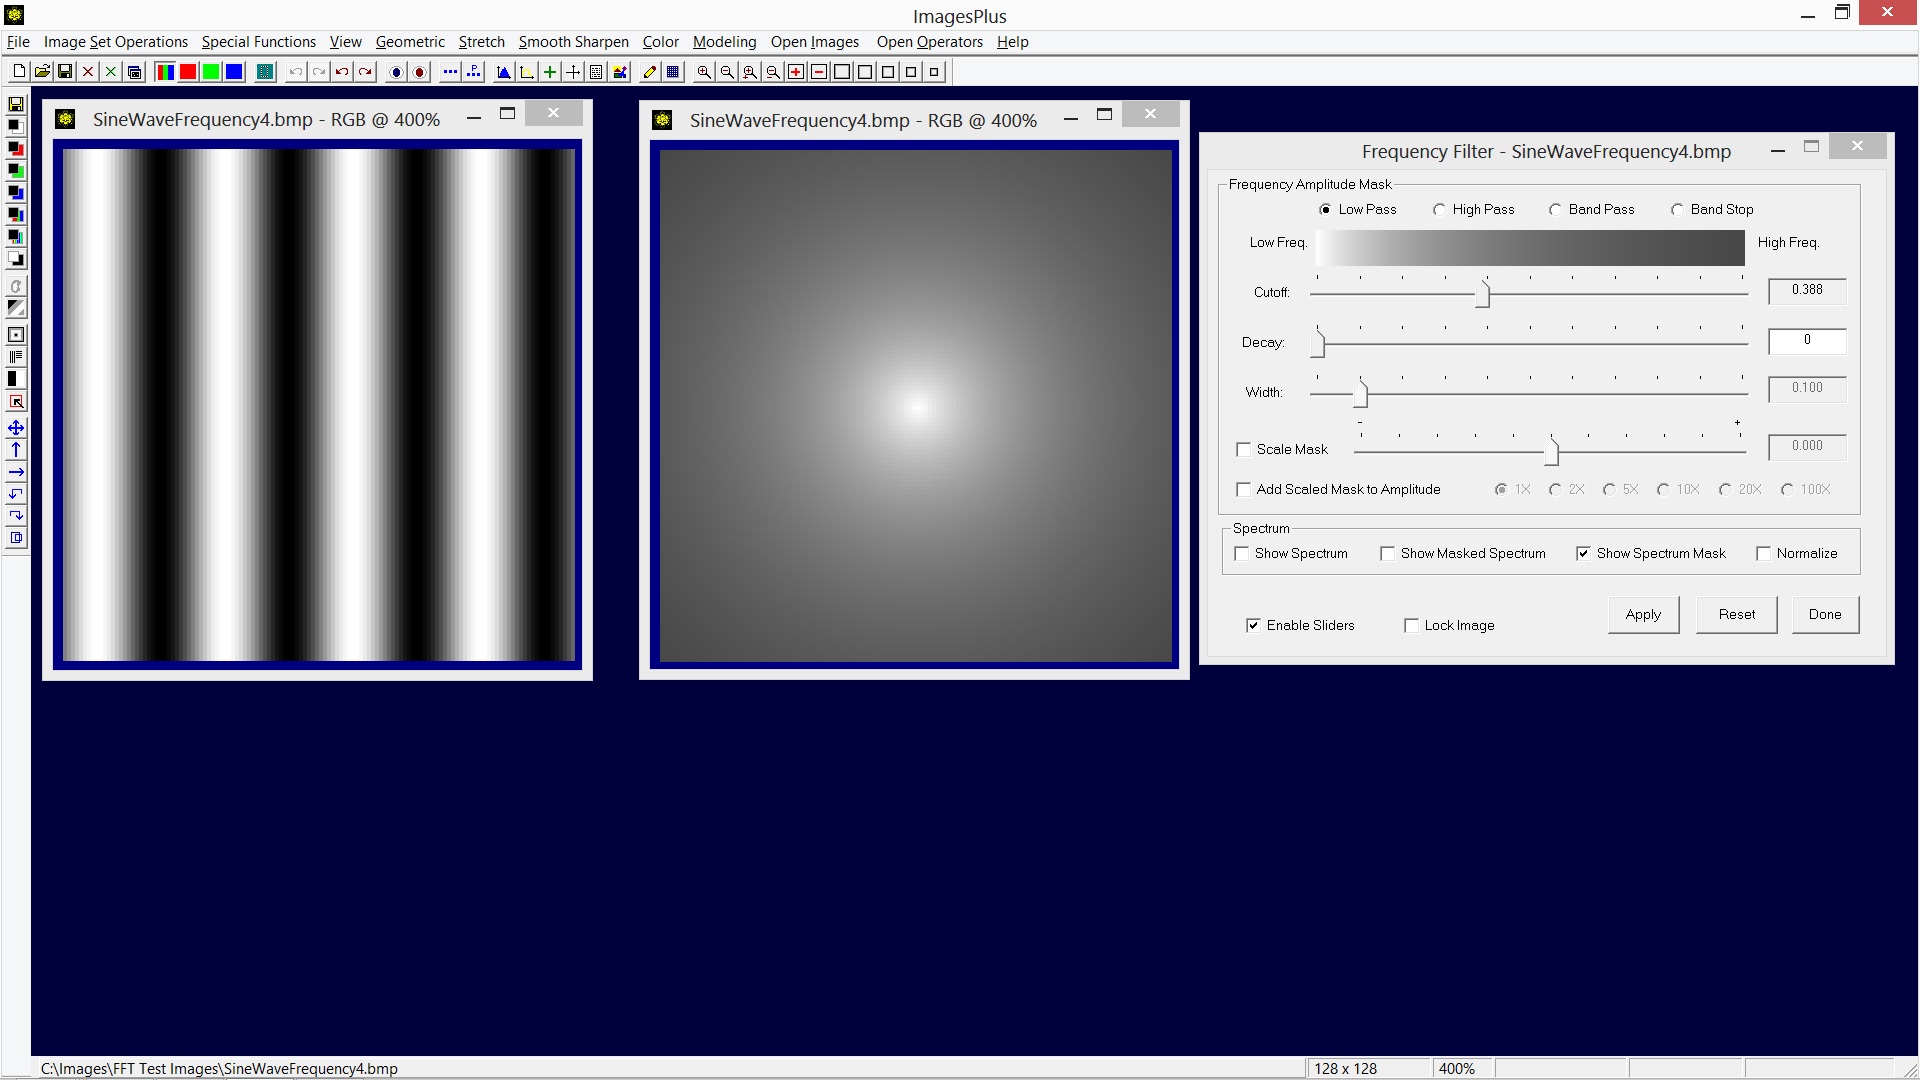
The low pass mask shown above is the result of increasing the cutoff frequency used with the previous example. As a result more of the outer high frequency amplitudes are passed with less attenuation.
 |
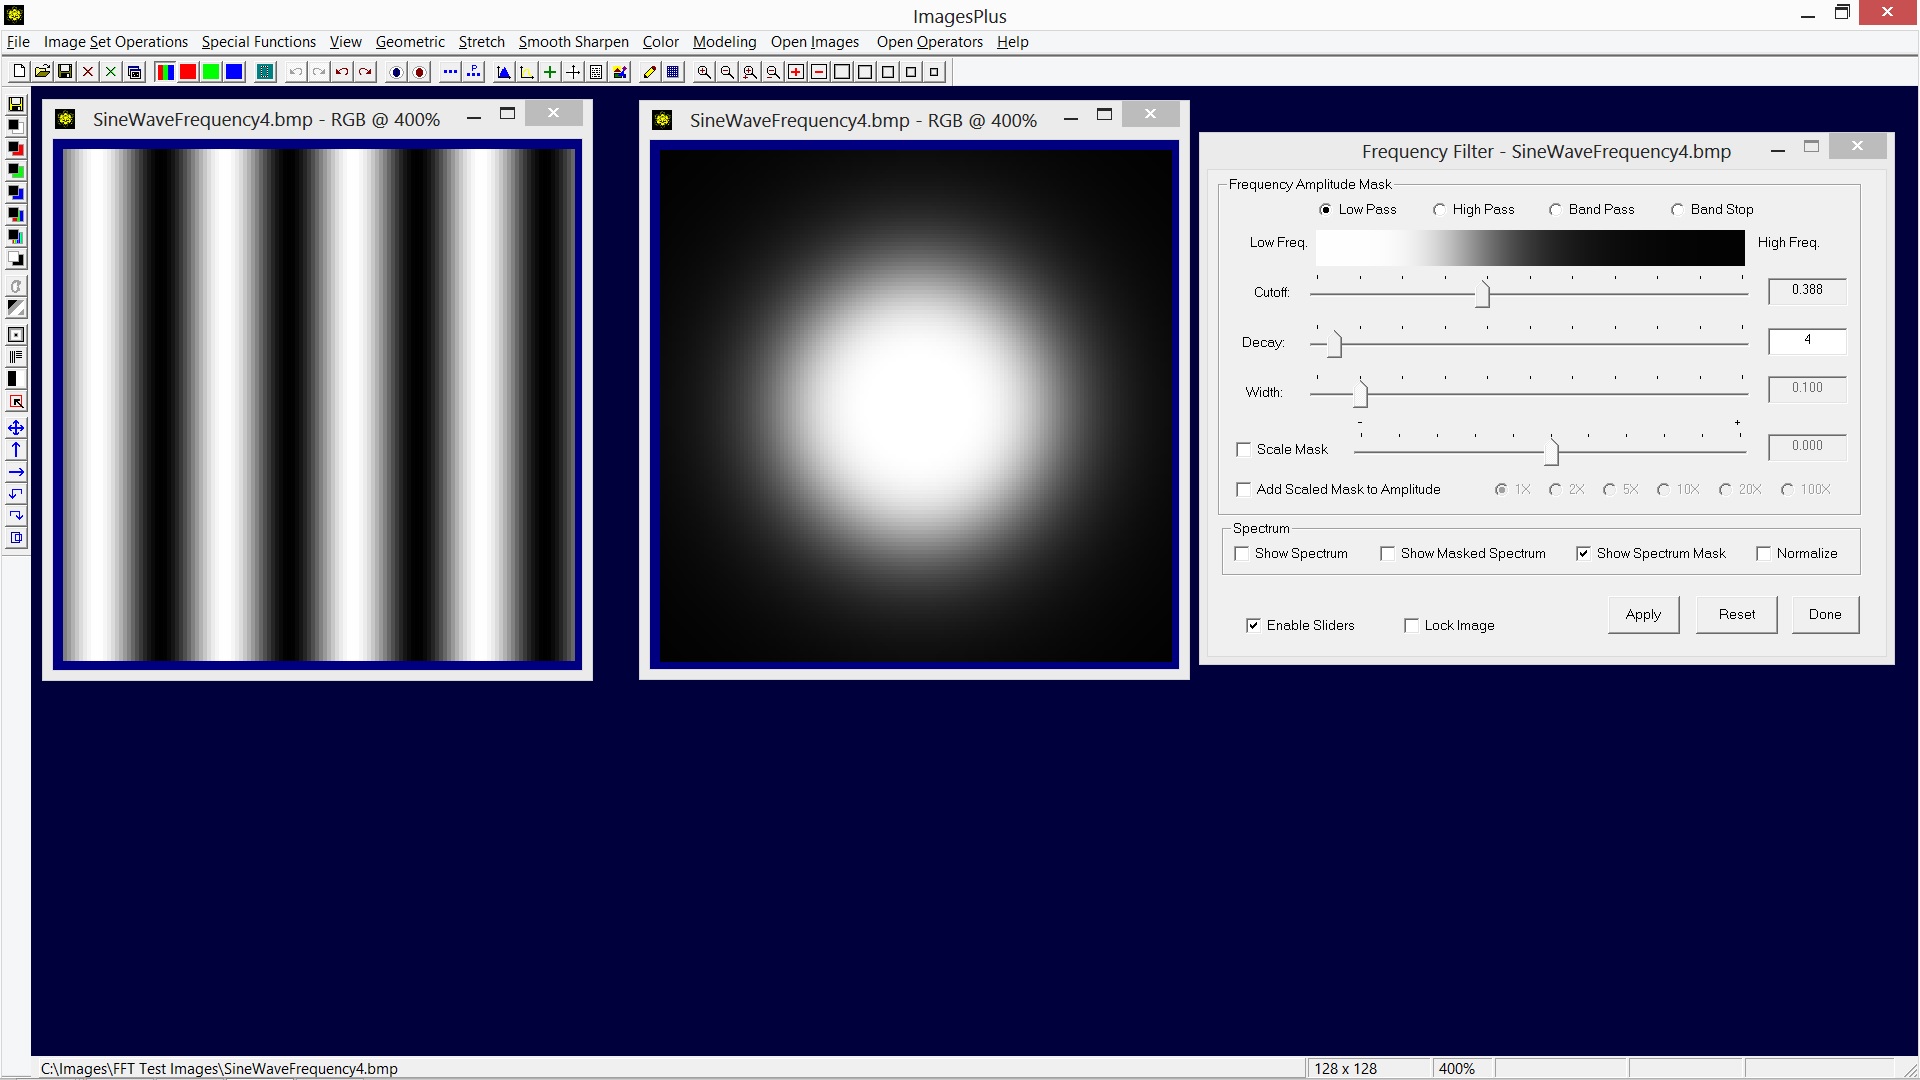
The low pass mask shown above is the result of increasing the decay value used with the previous example. As a result the mask changes from conceal black to reveal white much faster about the cutoff frequency.
 |
The mask above uses the High Pass option and same cutoff and decay values as the low pass mask in the previous example. The high pass mask is the inverse of a low pass mask when the same cutoff and decay are used. The high pass mask passes or reveals high frequency amplitudes from small object like stars and conceals low frequency amplitudes from galaxies or nebulas.
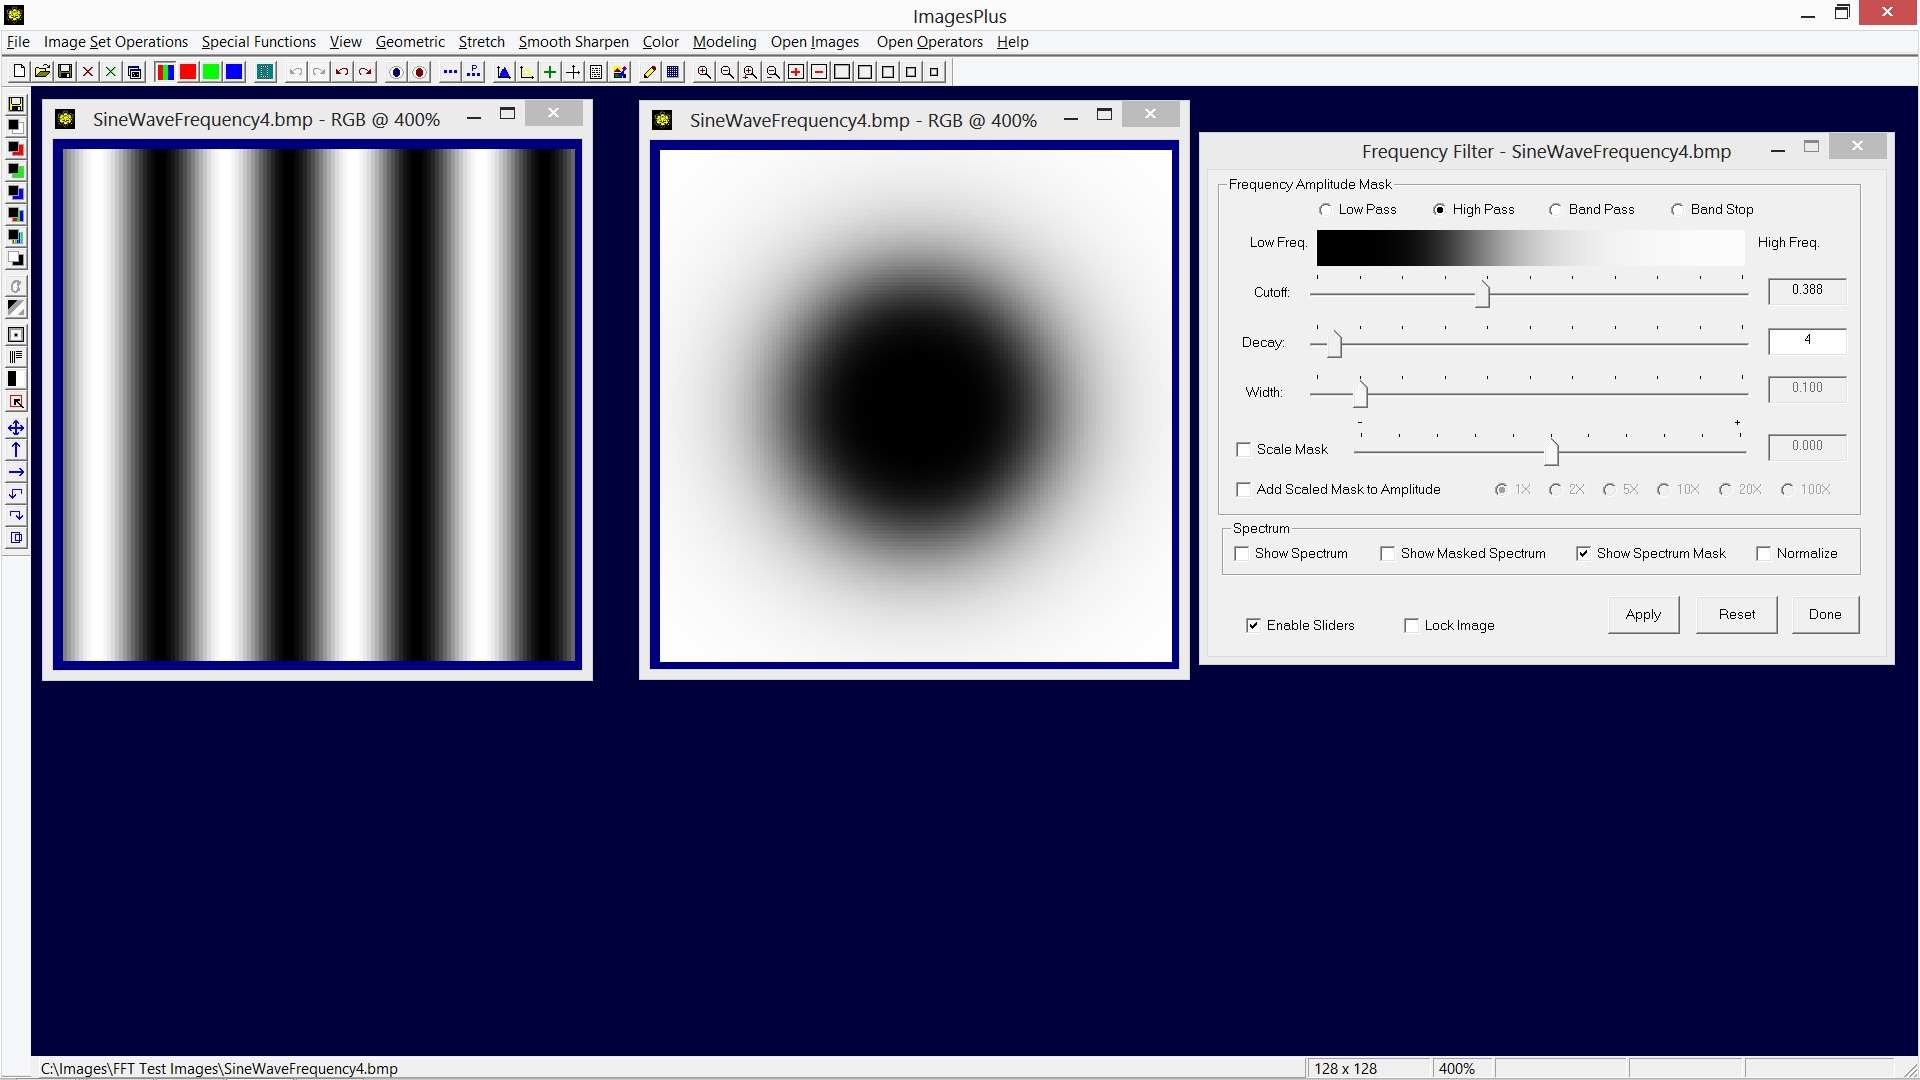 |
The Band Pass option is used to select a range of frequency amplitudes. The Cutoff and Decay sliders work the same as when used with the Low Pass and High Pass options. The Width slider is used to adjust the width of the frequency range.
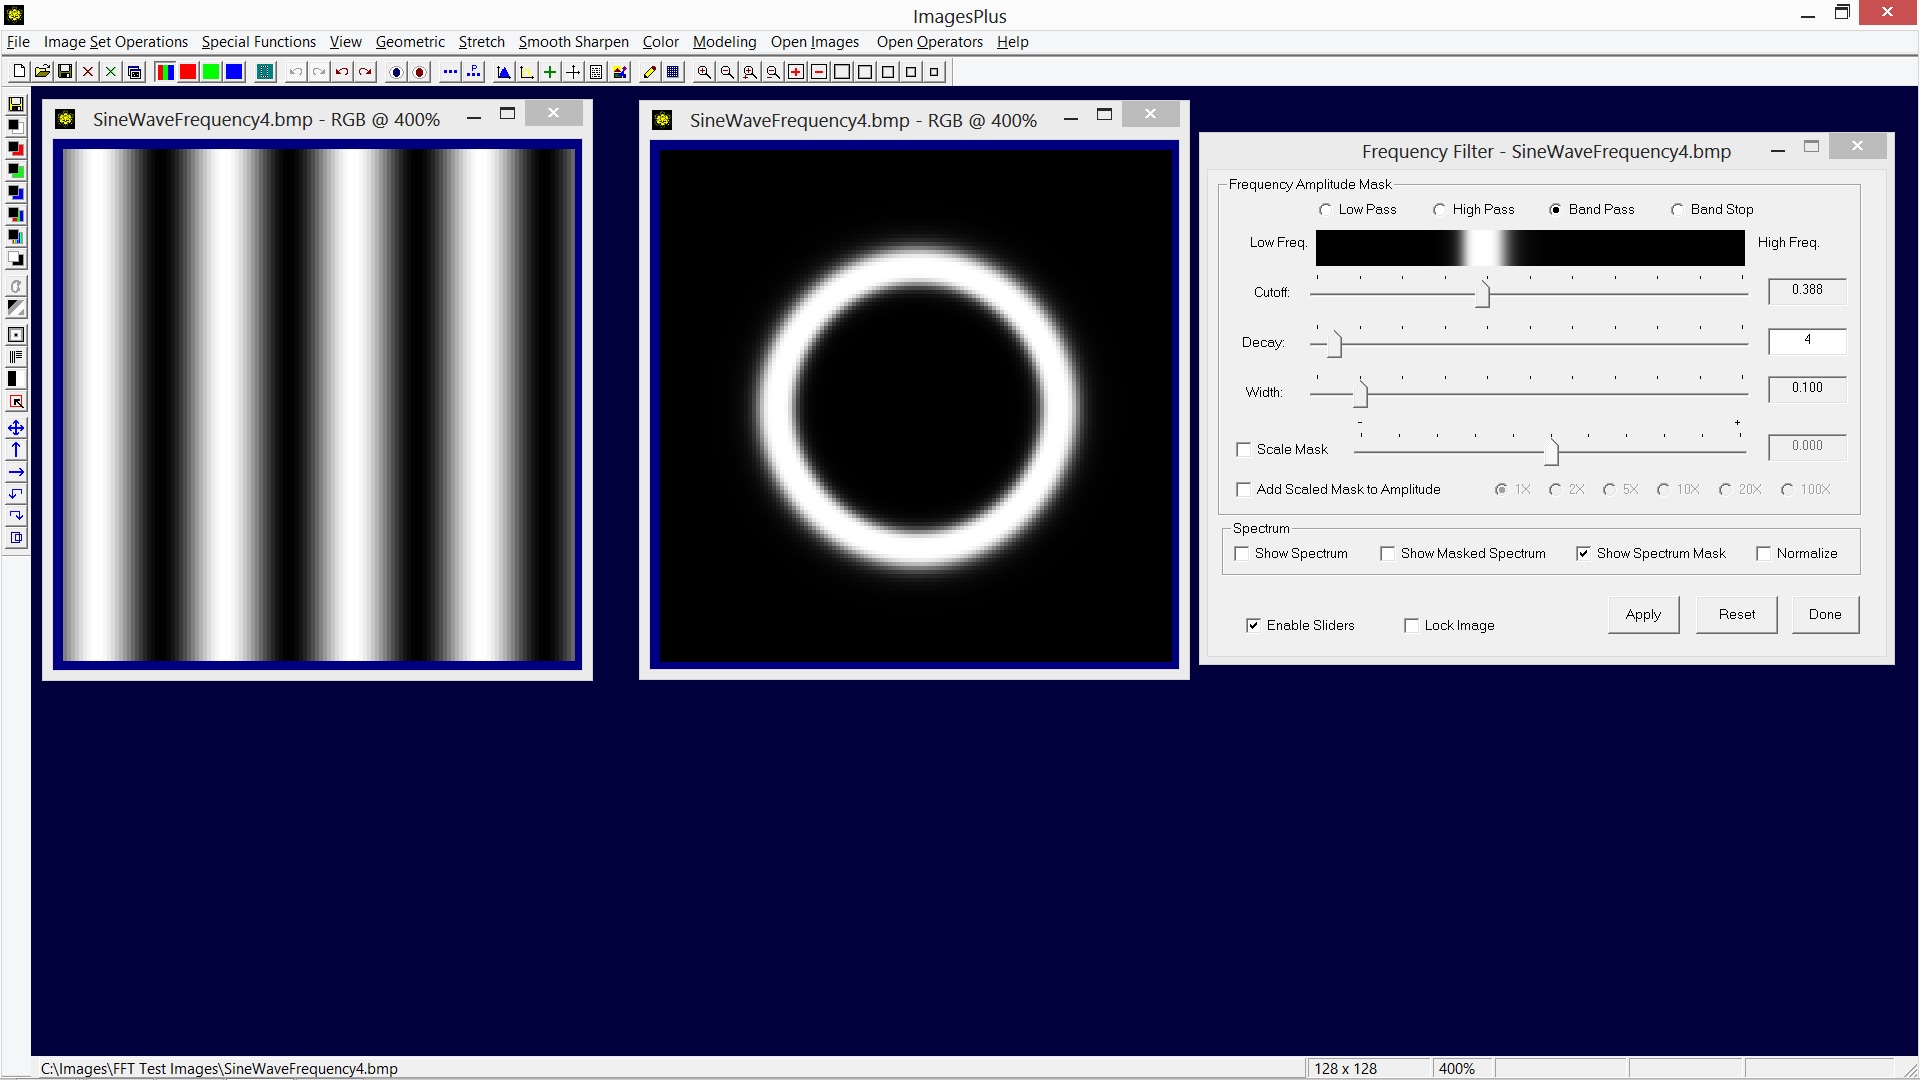 |
The band pass mask above uses the same cutoff and decay values as the previous mask example. The width slider was moved to the right to increase the width of the band pass range.
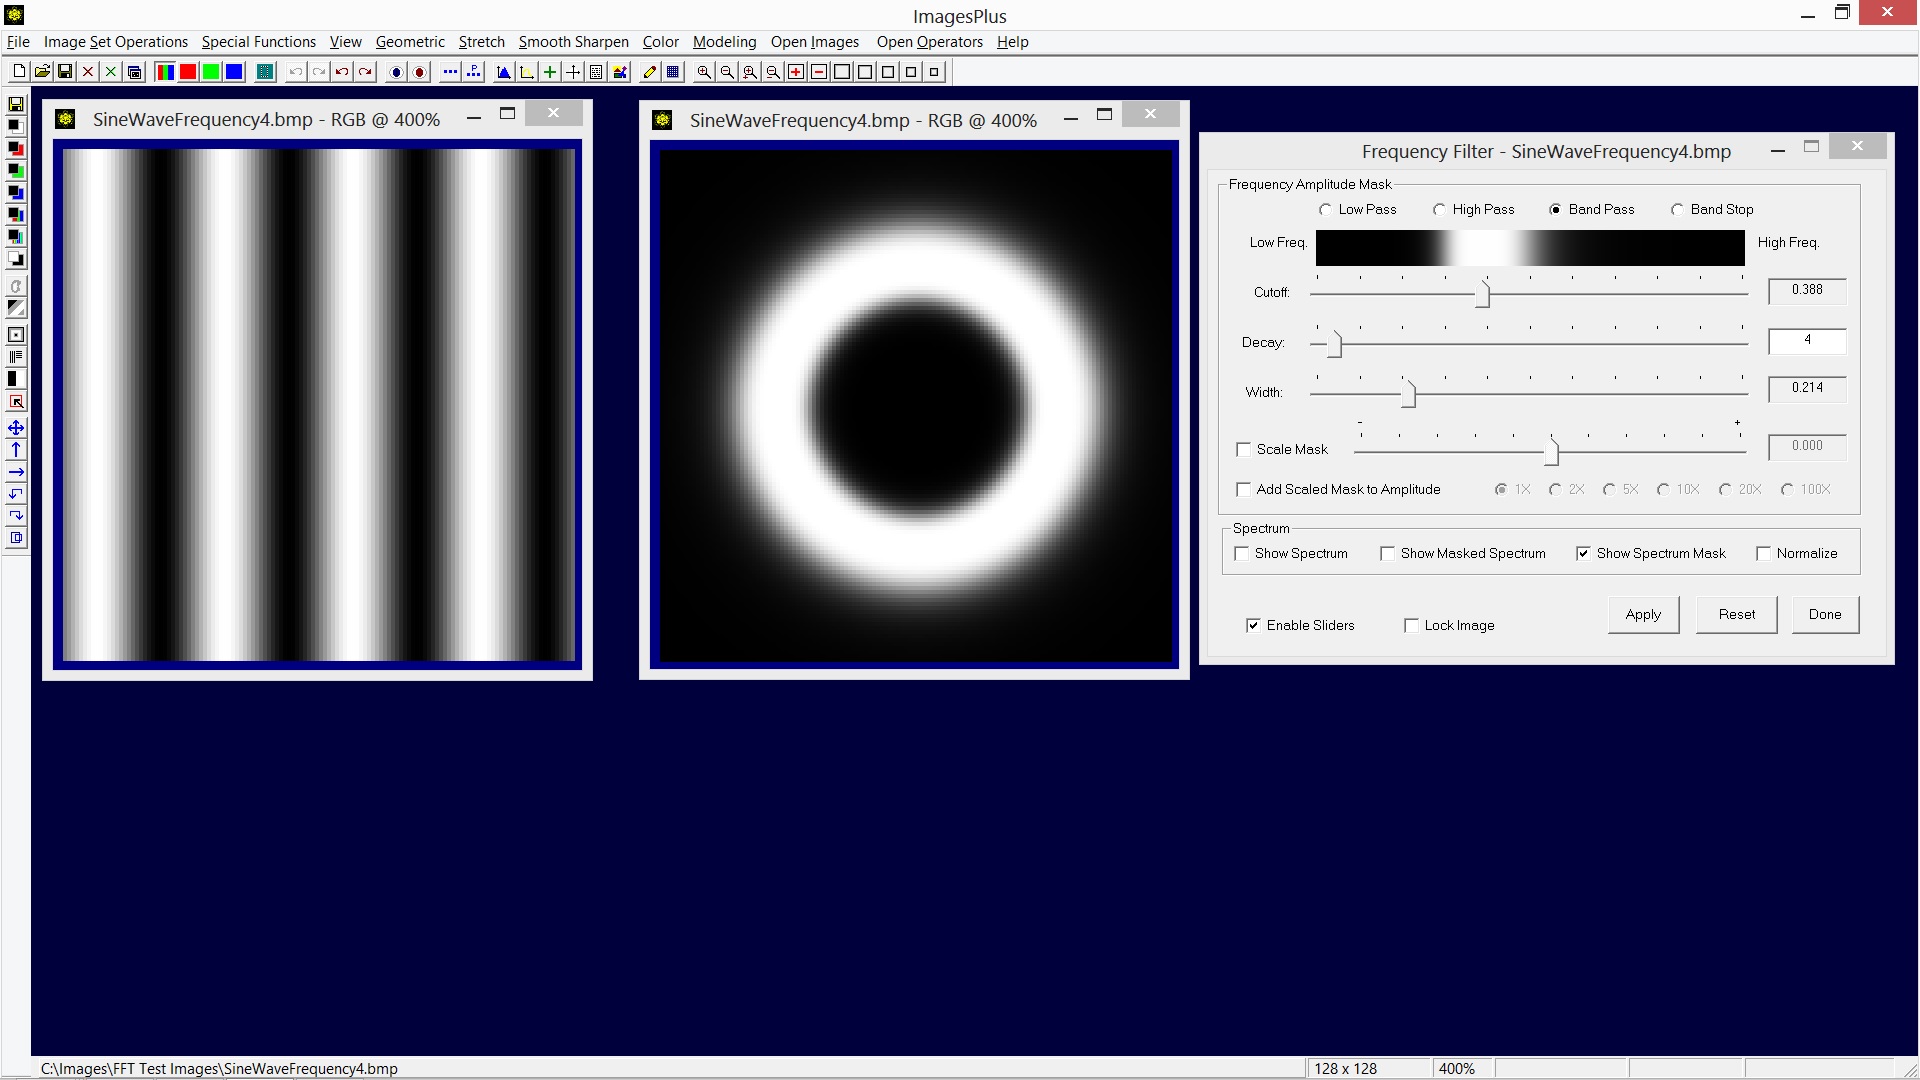 |
The Band Stop option is used to stop a range of frequency amplitudes. The Cutoff and Decay sliders work the same as when used with the Low Pass and High Pass options. The Width slider is used to adjust the width of the frequency range. A band stop mask is the inverse of a band pass mask.
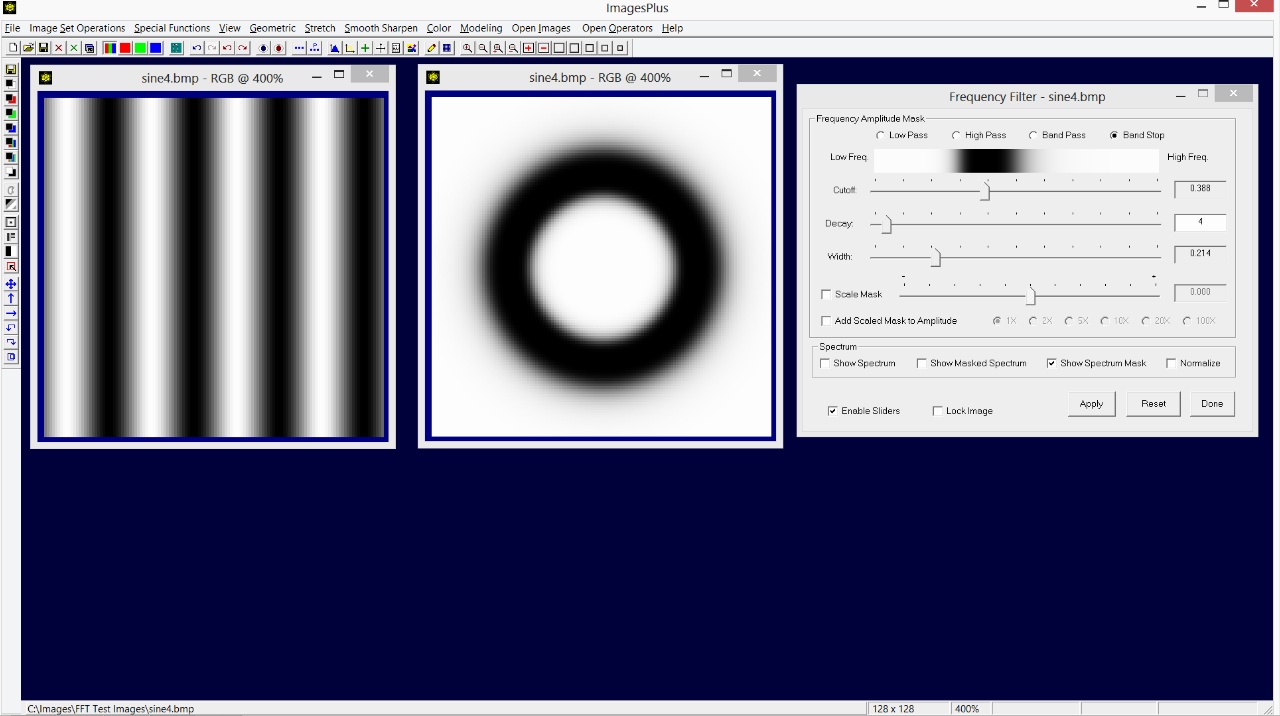 |
-
The above examples demonstrate the creation of spectrum masks using the Frequency Filter with Show Spectrum Mask option. A spectrum mask is used to smooth, sharpen, and create masks by increasing or decreasing a range of frequency amplitudes. The next examples use the Show Masked Spectrum option of the Frequency tool to display the masked spectrum and the change to an image.
The initial image is shown on the left with its masked low pass spectrum shown at the center. The smoothed image shown on the right is the result of applying the low pass frequency filter without the Show Masked Spectrum option to the initial image.
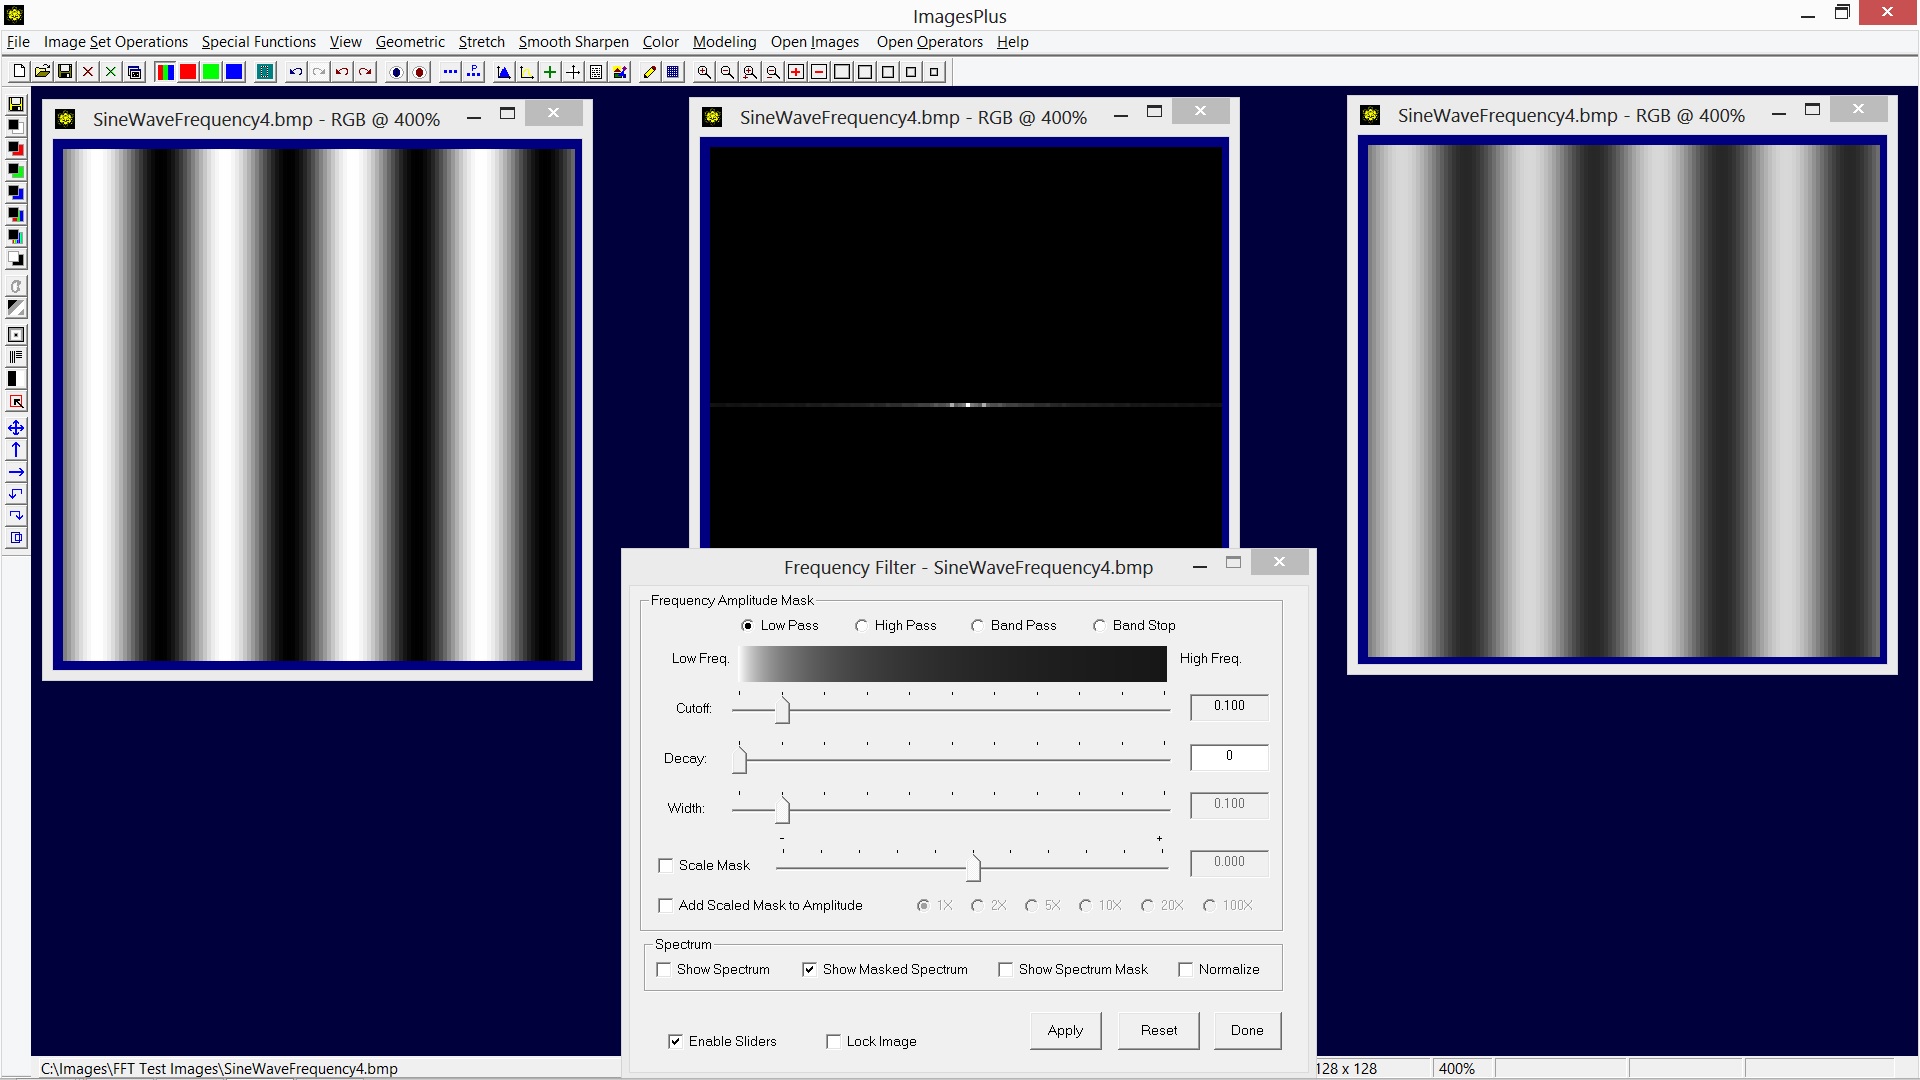 |
The decay value is set to produce a sharp cutoff and the cutoff value is set at a 4 pixel radius. Now the masked spectrum only contains frequencies 4 or less. Since the image is a wave of frequency 4 the result of the Frequency Filter is a very soft smoothing shown on the right.
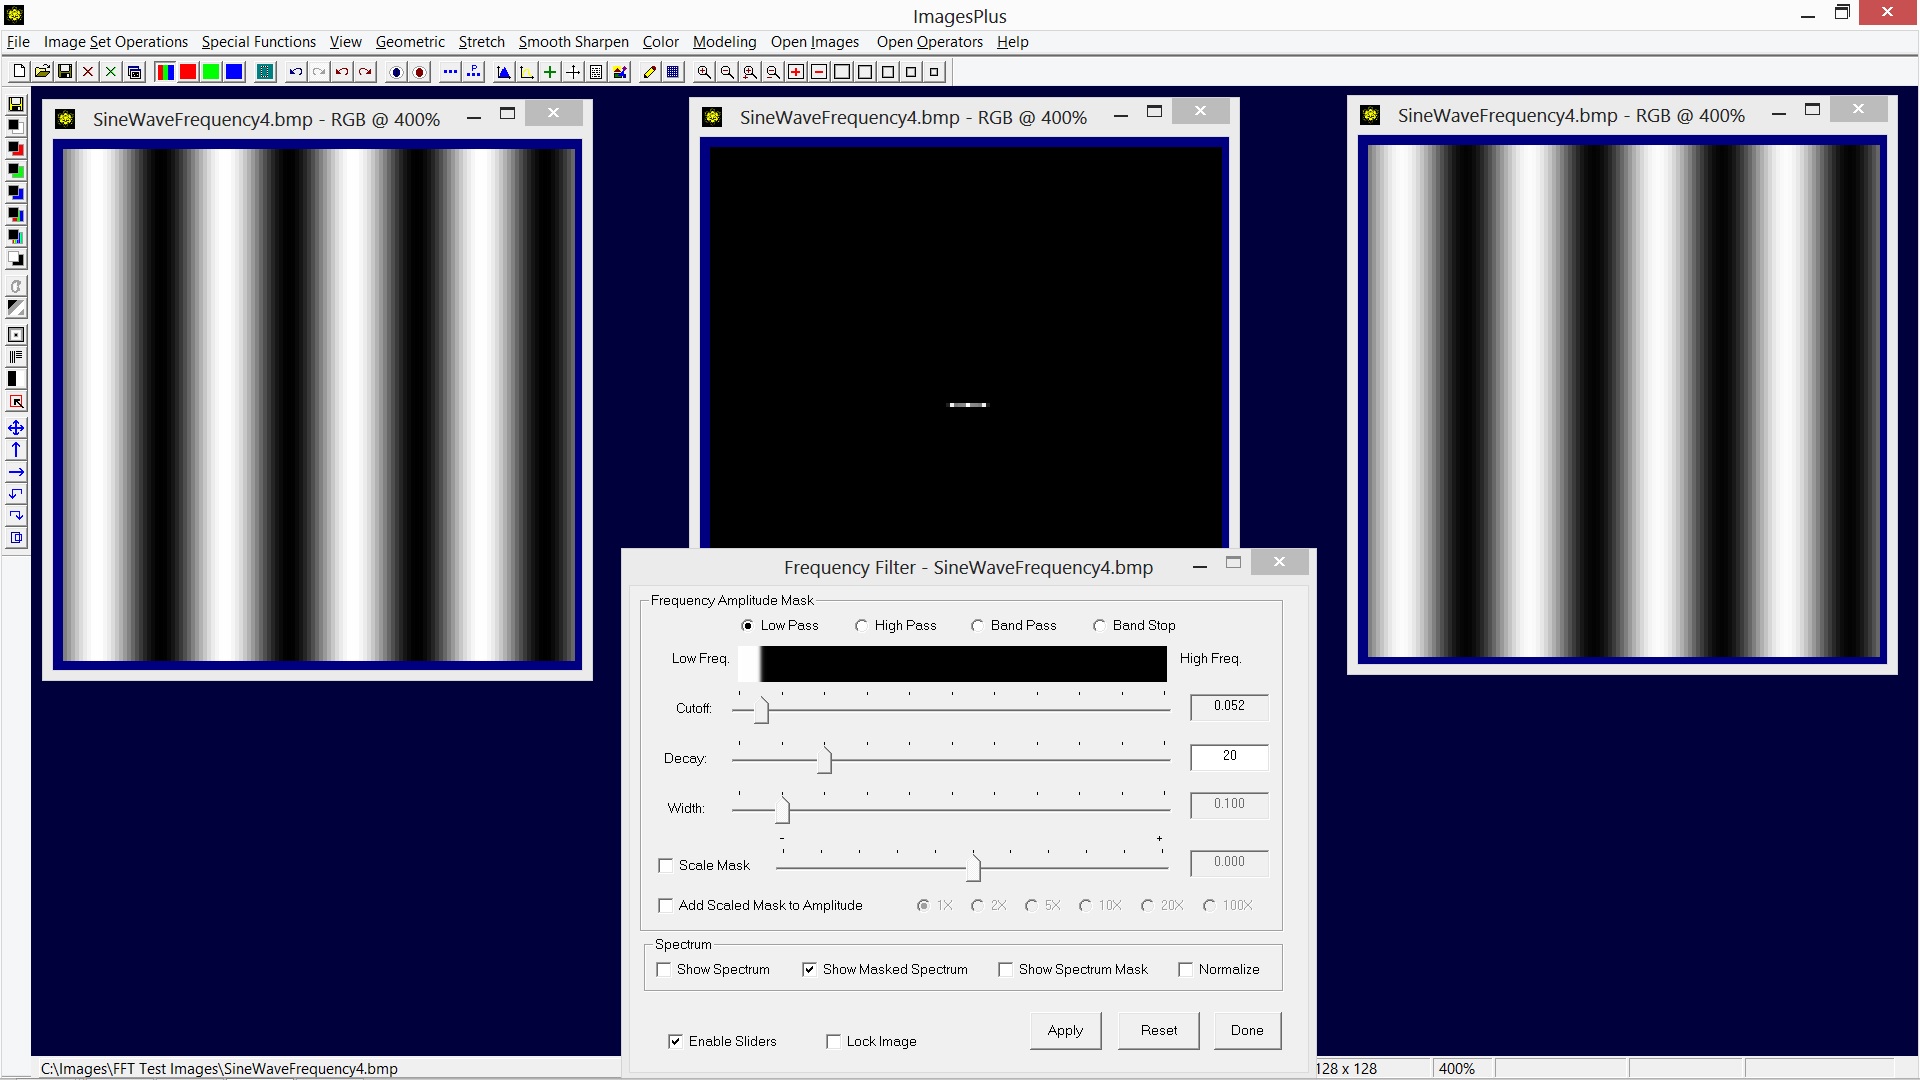 |
The cutoff slider is adjust toward the left to exclude the frequency 4 pixels as shown by the center spectrum. As a result the wave of frequency 4 is mostly removed as shown by the image on the right.
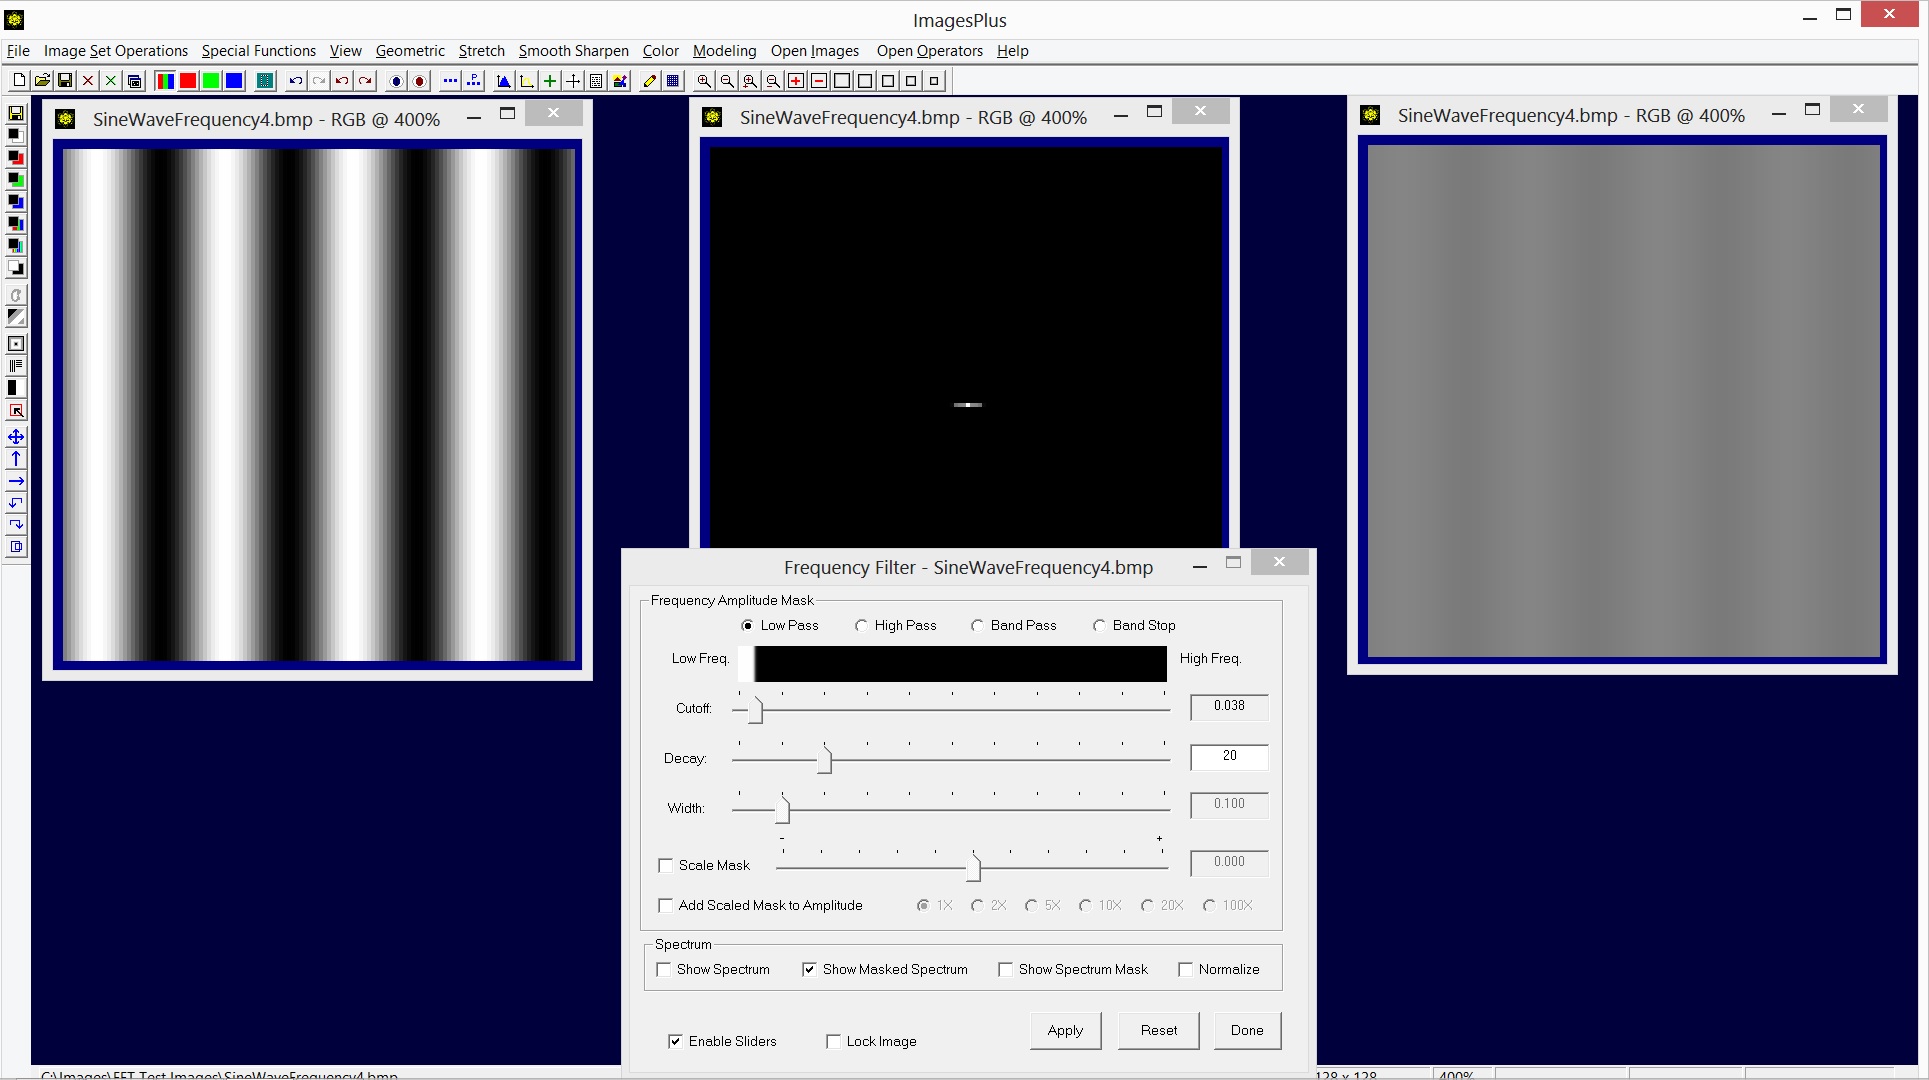 |
Same cutoff and decay values used with the previous example but now the High Pass option is selected to include only frequencies greater than or equal 4 as shown by the masked spectrum. The image on the right shows the higher frequency waves isolated by the high pass filter.
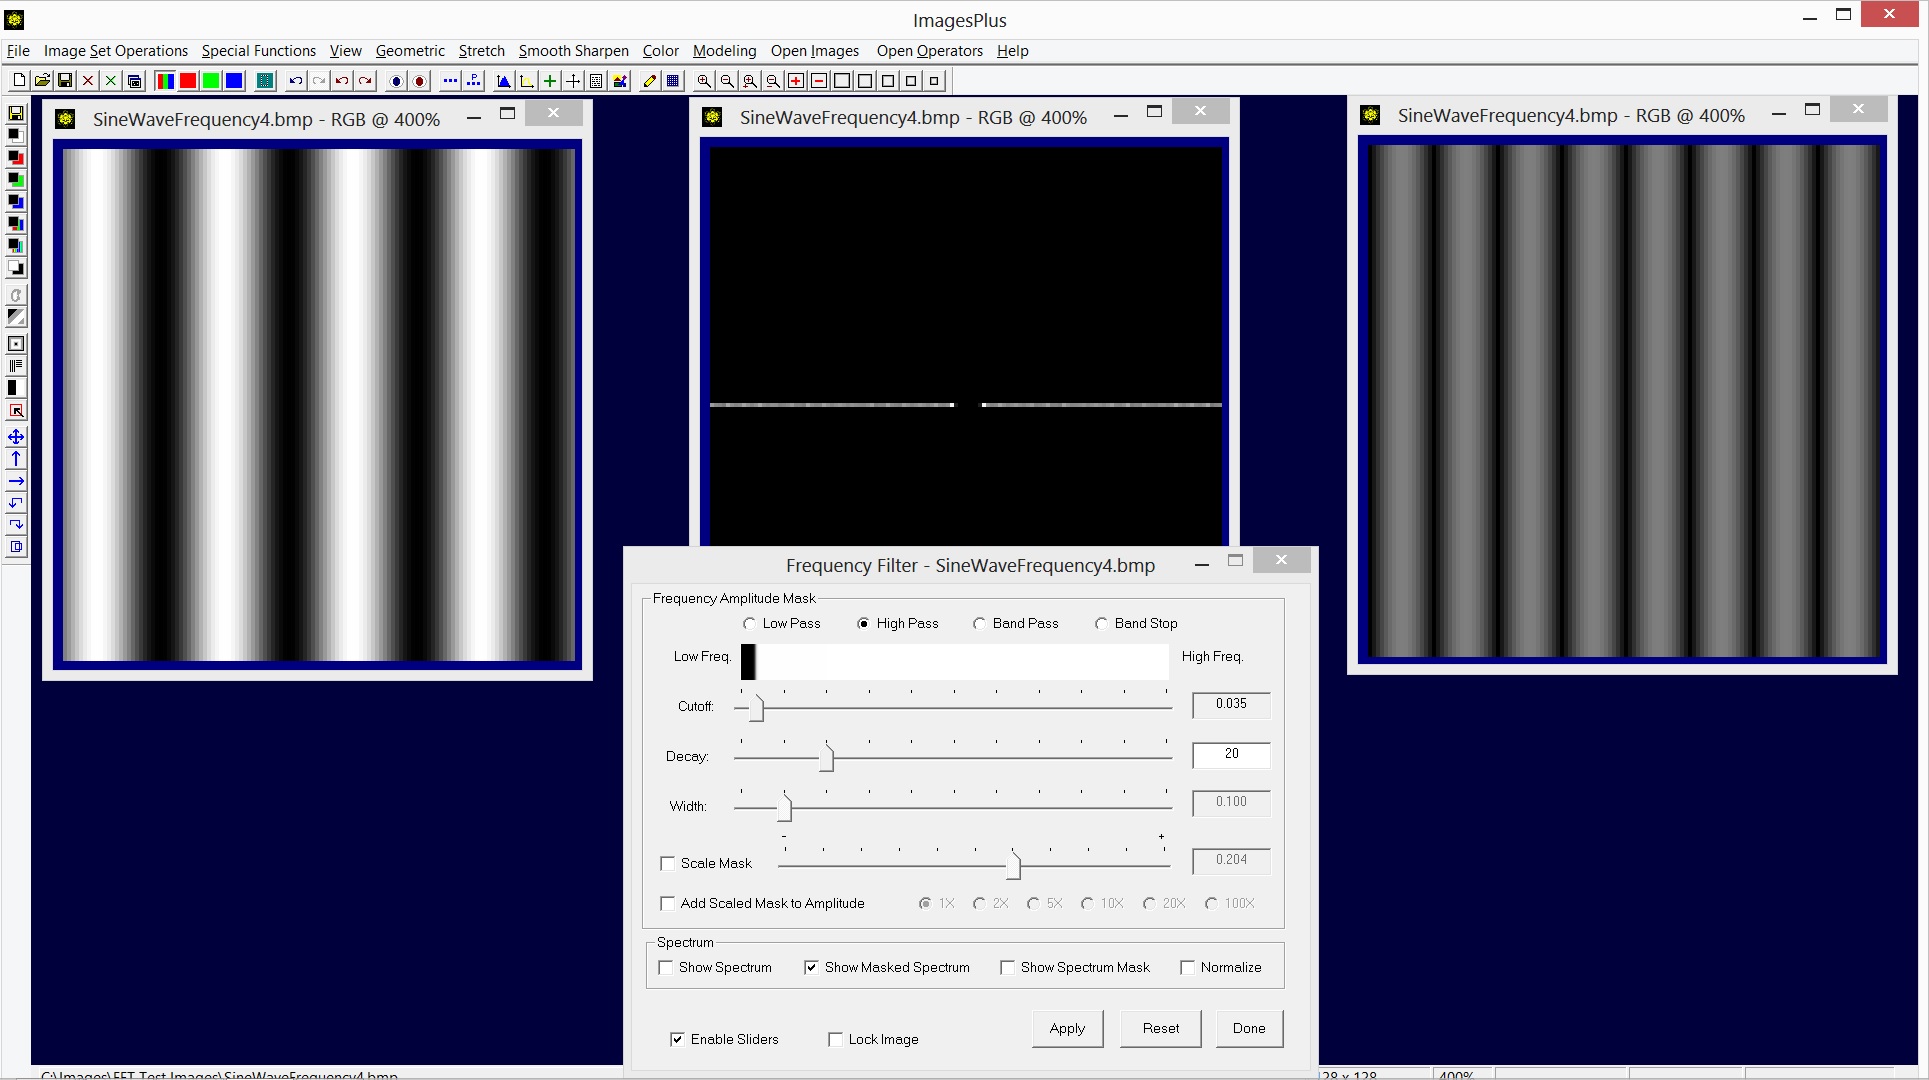 |
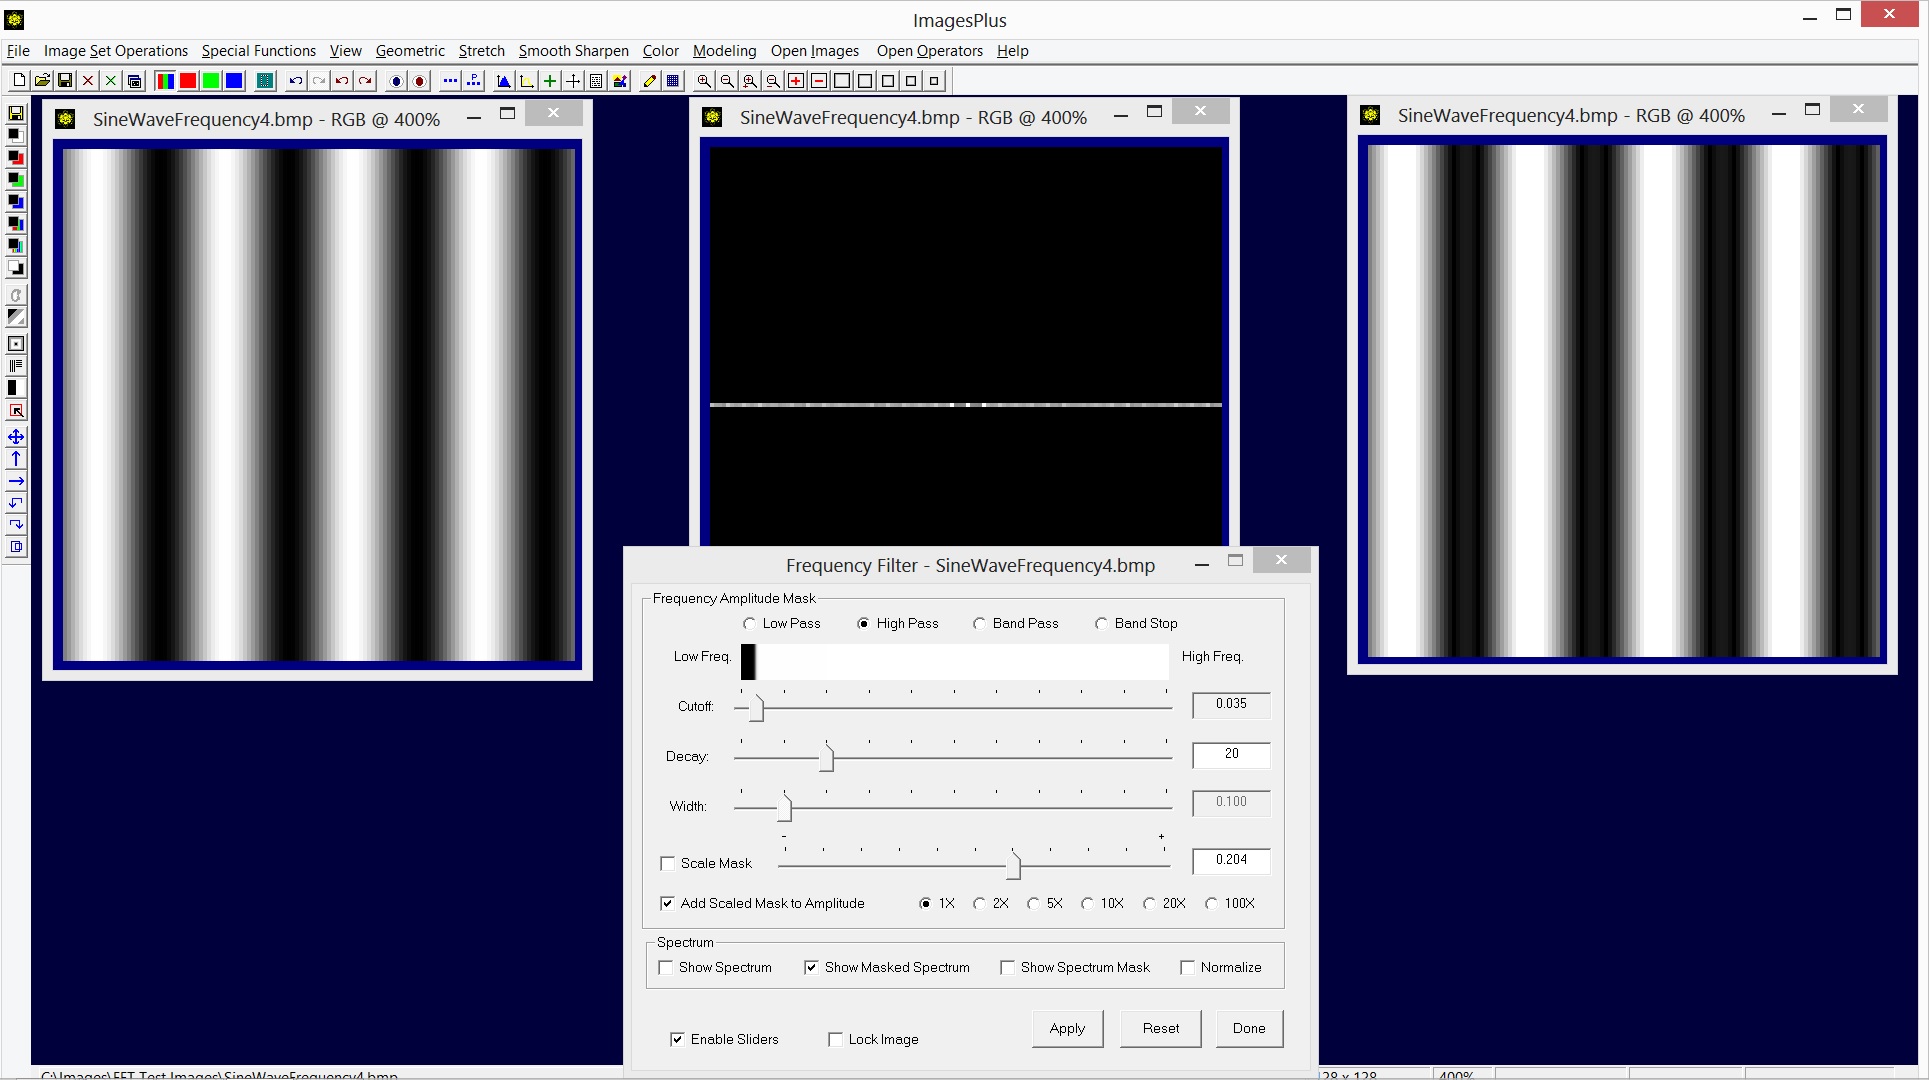
The high pass filter can be used to increase high frequency amplitudes to produce a sharper image. The above example shows the high pass filter used with the Add Scaled Mask To Amplitude option to increase the amplitude of higher frequencies and leave the lower frequencies unchanged. The sharpened image is shown on the right.
 |
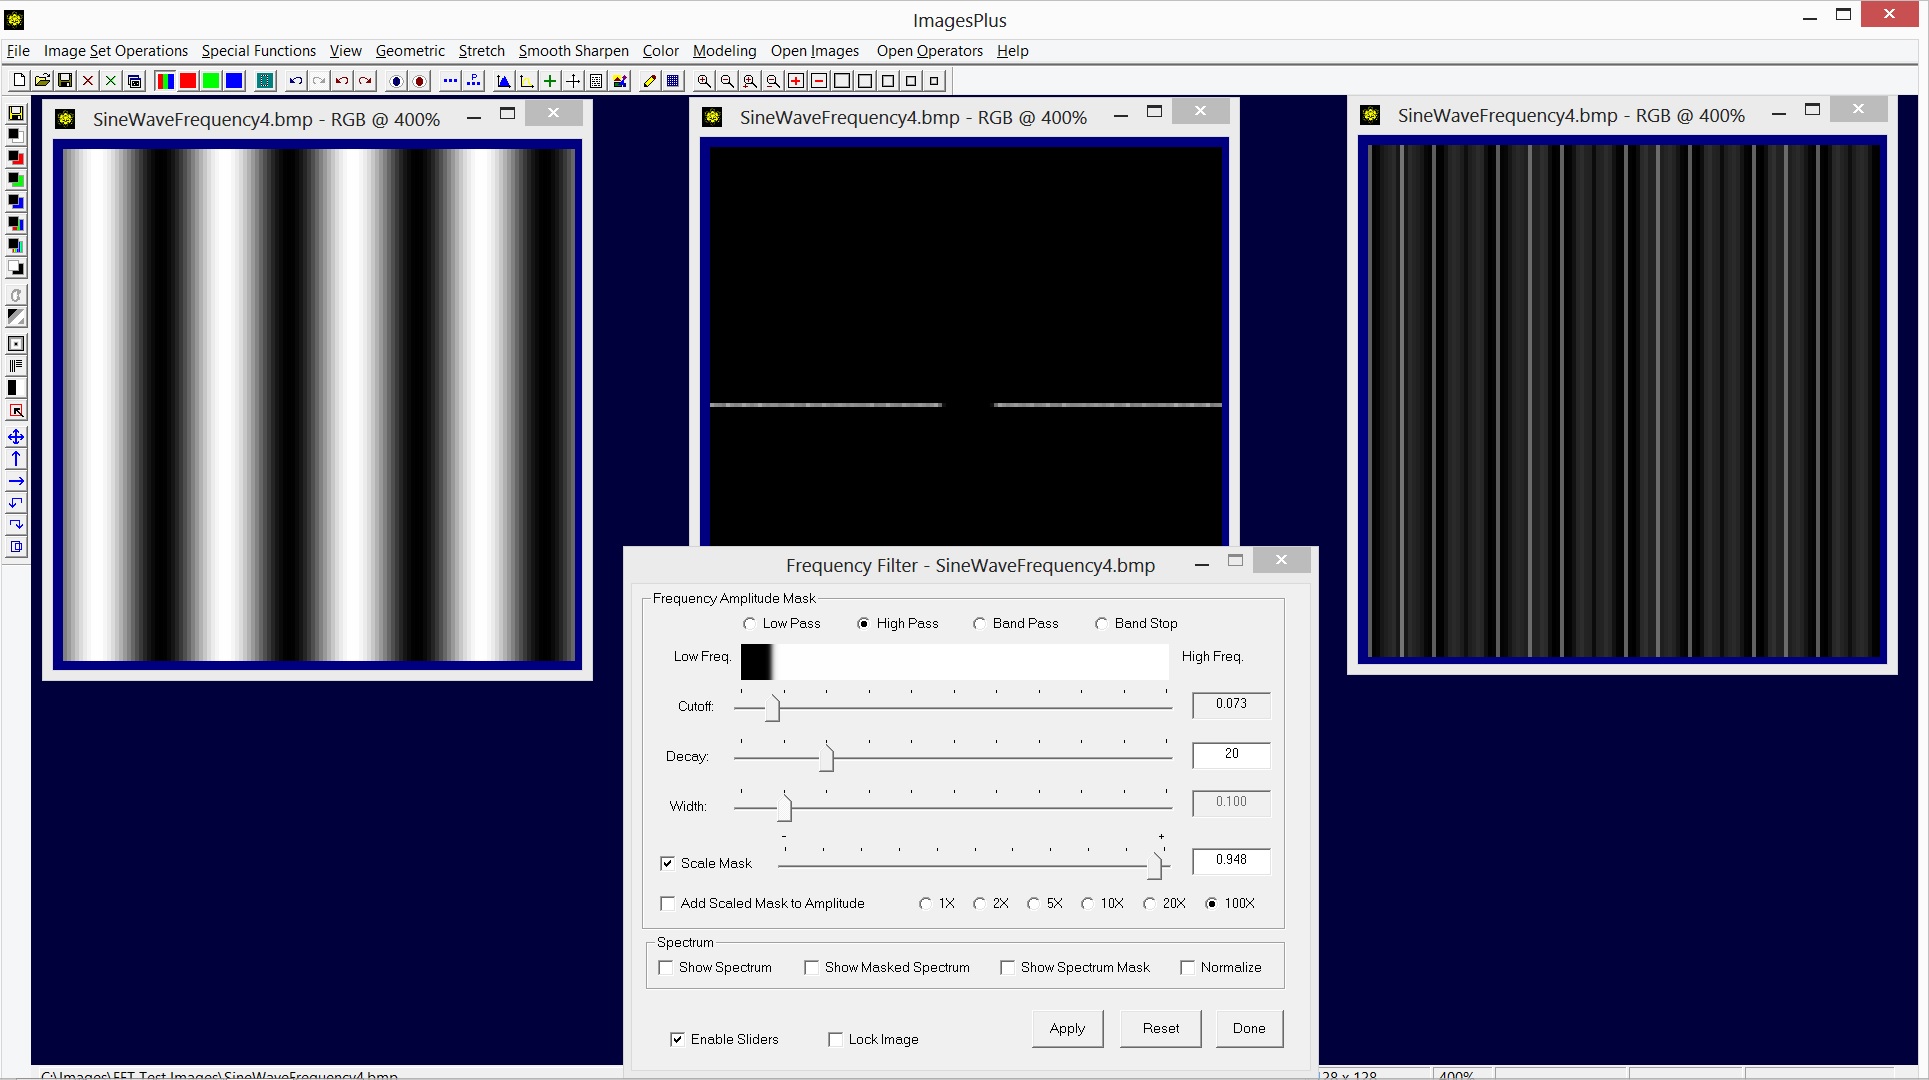
The high pass filter can be used to create an edge image of just the higher frequencies. The high pass edge image is very dark since the center DC pixel that represents the average color of the image has been blocked by the high pass mask as shown by the masked spectrum image at the center. The Scale Mask option is used to increase the amplitude of the higher frequencies as shown by the image on the right.
 |
Practical Applications of the Frequency Filter
- Smoothing
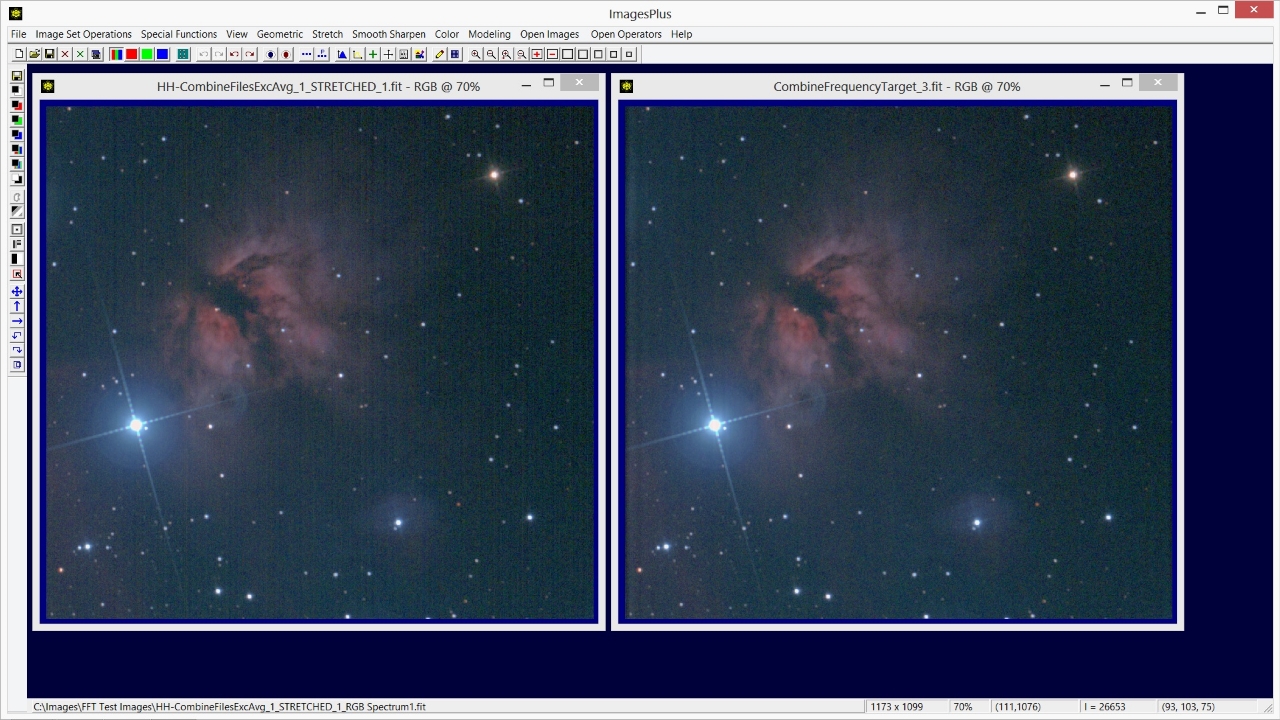
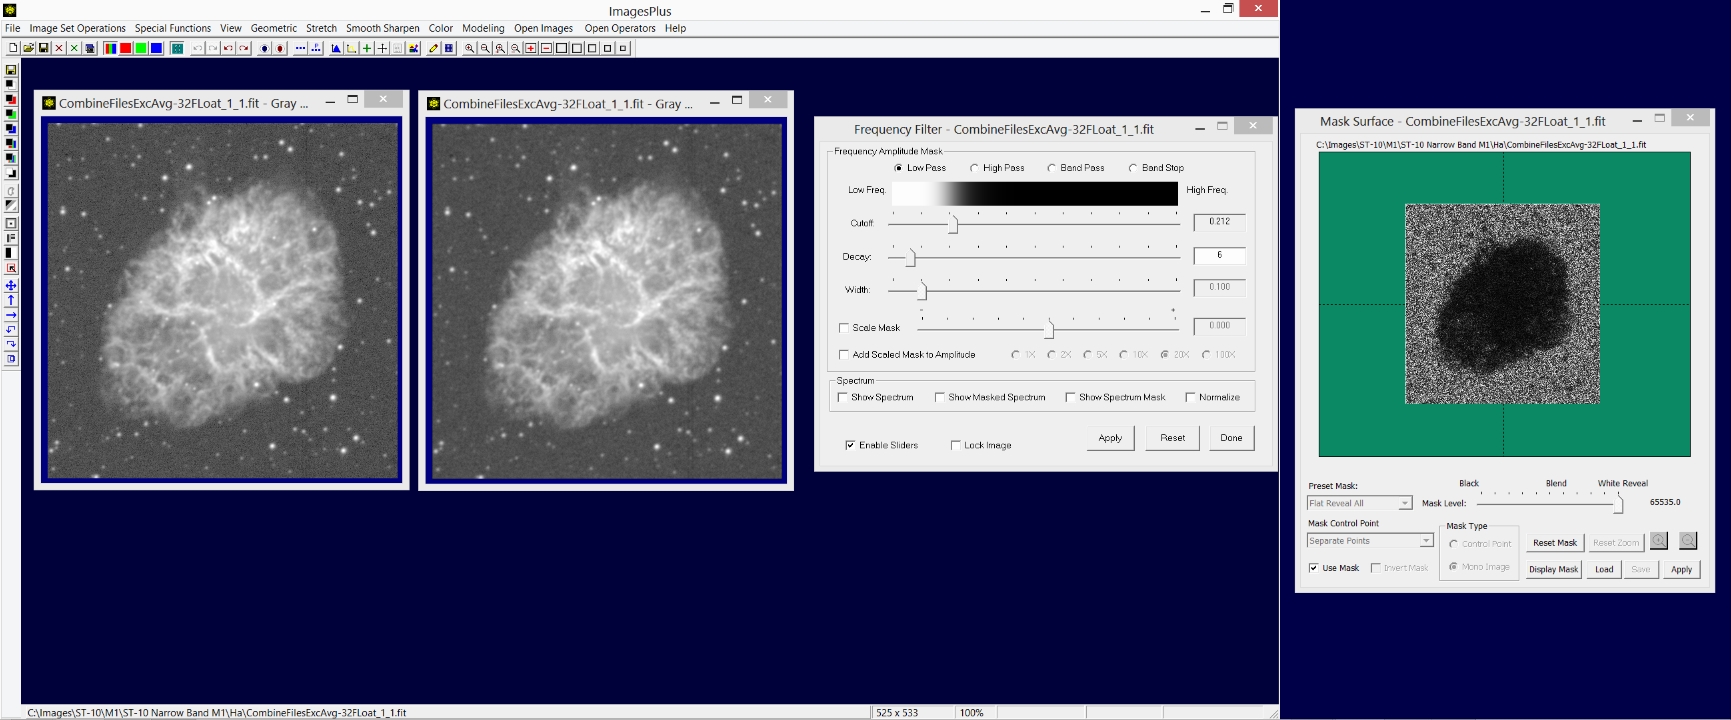
The Frequency Filter Low Pass and Band Stop options can be used to smooth an image. A mask can be used with the Frequency Filter to add localized control as shown above. For details see the Smoothing an Image Using the Frequency Filter tutorial.
 |
- Sharpening
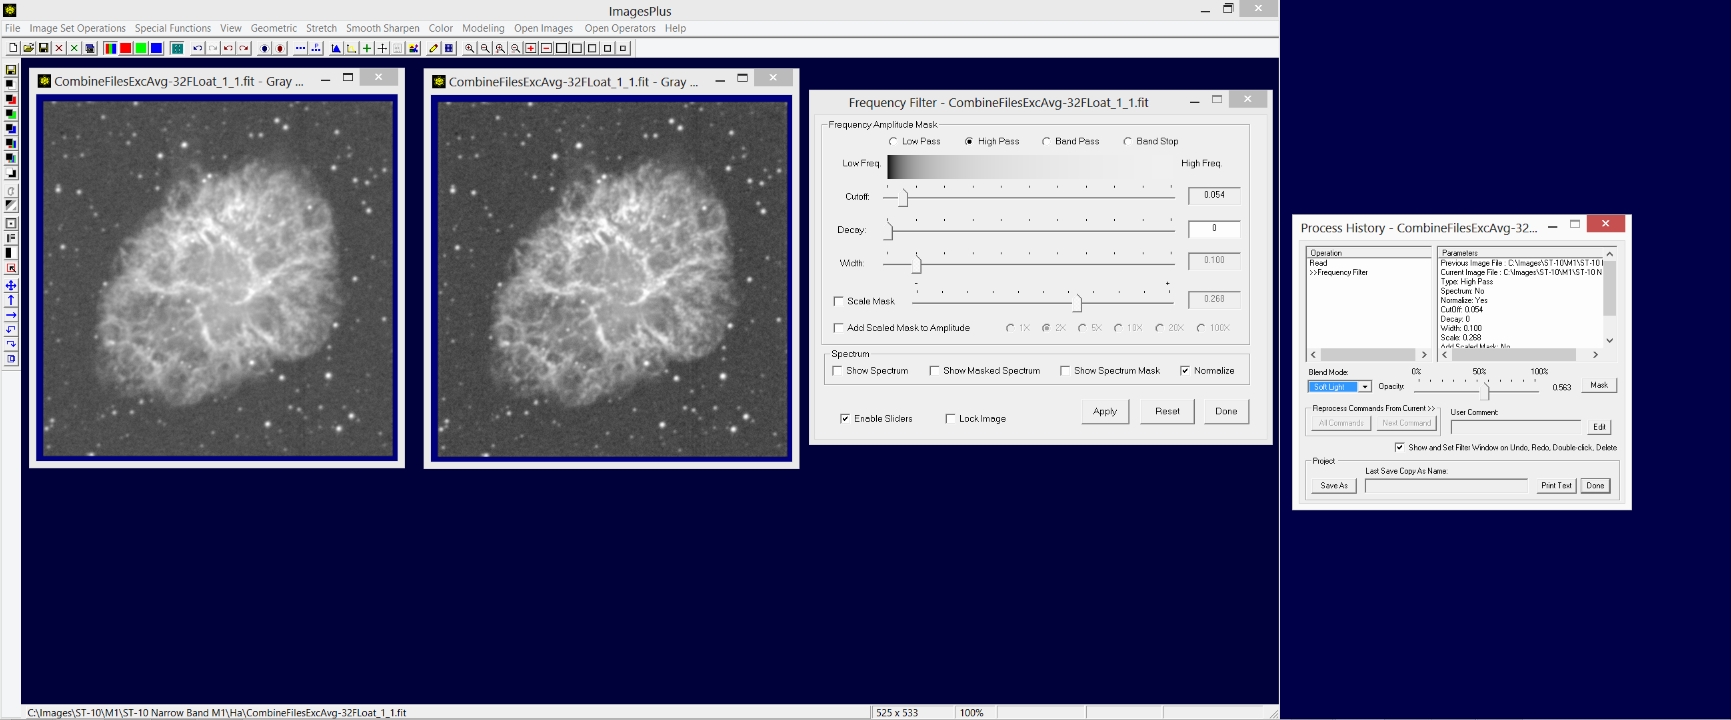
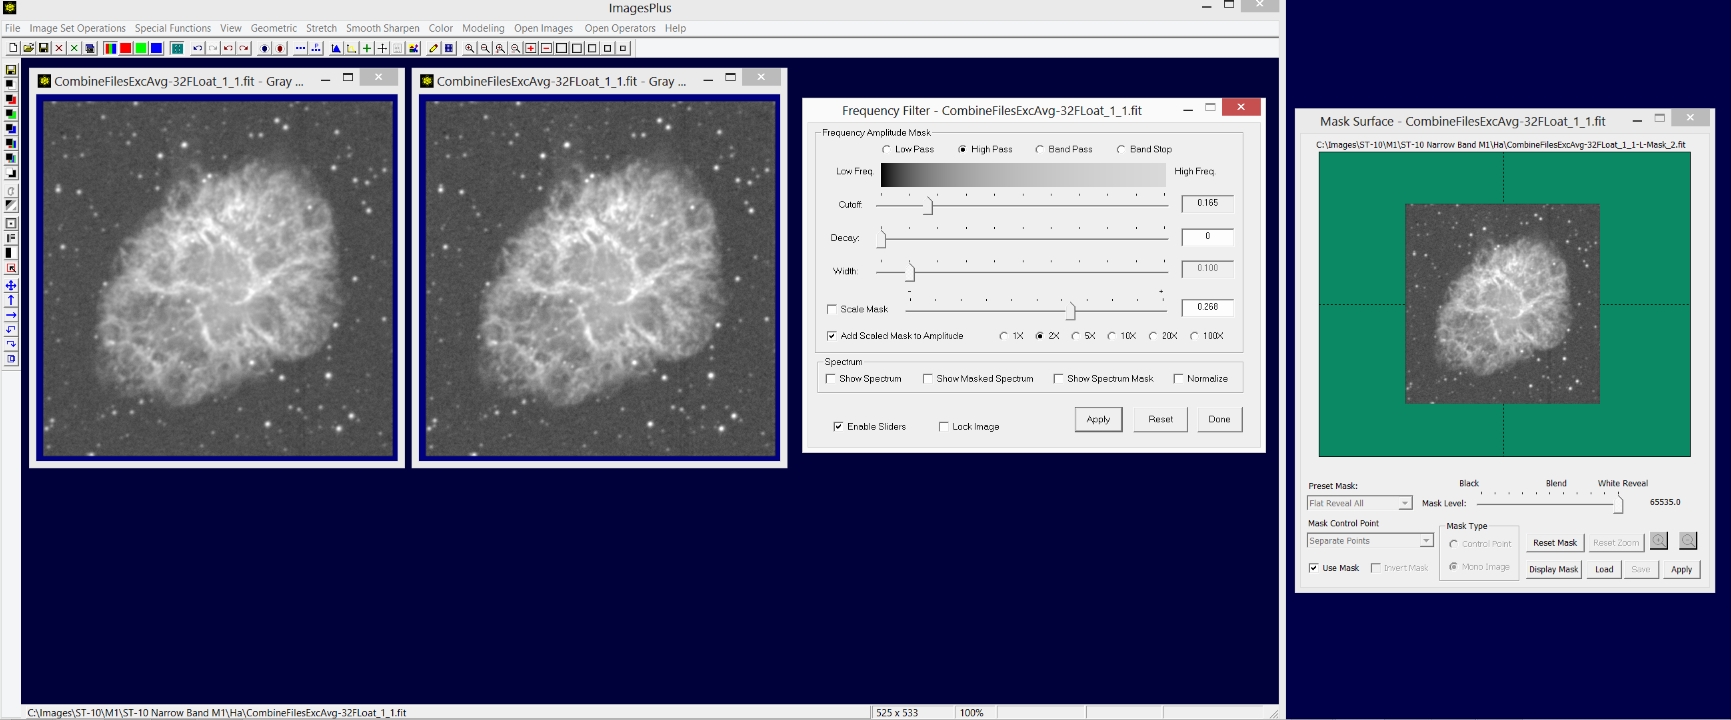
The Frequency Filter High Pass and Band Pass options can be used to sharpen an image. A mask can be used with the Frequency Filter to add localized control as shown above. For details see the Sharpening an Image Using the Frequency Filter tutorial.
 |
- Contrast Enhance & High Pass Sharpen
- Create Star and Object Masks
- Structured Noise Detection and Removal
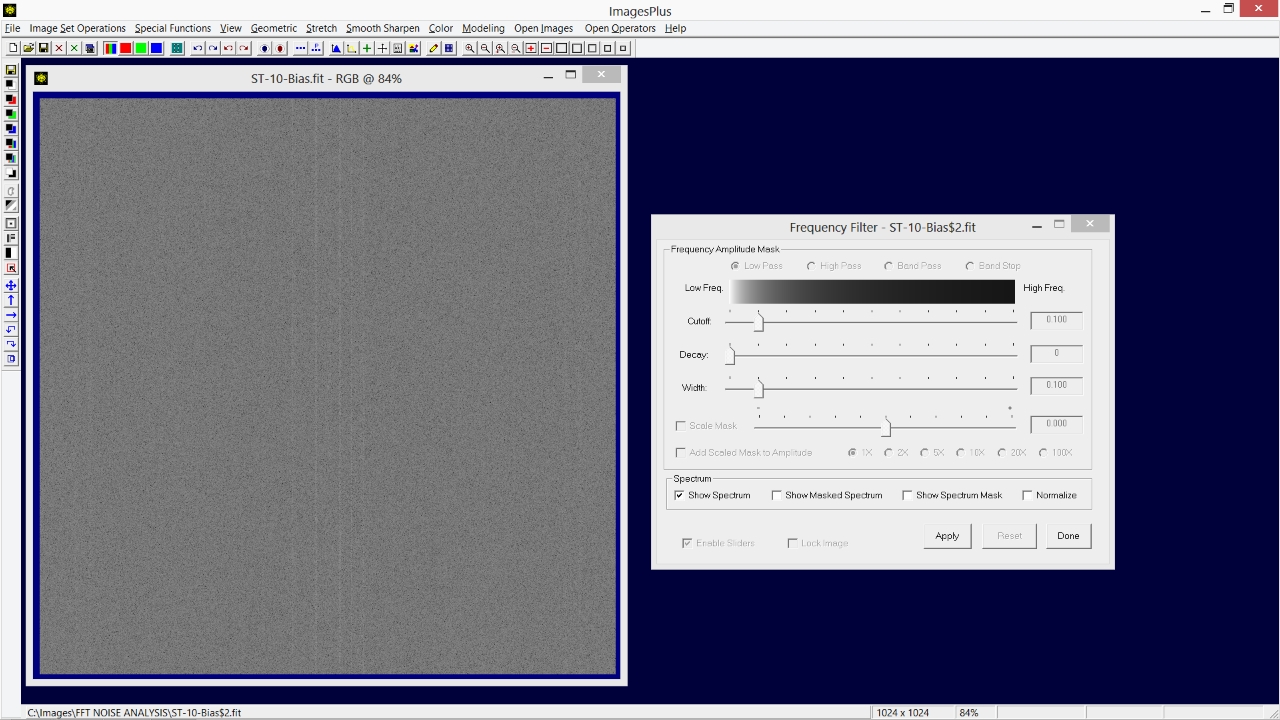
Structured or periodic noise of a DSLR, one shot color CCD, and monochrome CCD camera that is not removed by calibration or stacking can be detected by the frequency spectrum using the Frequency Filter shown above. The vertical and horizontal lines in the spectrum of a bias frame with an average bias subtracted show the frequencies of the structured noise. Structured fixed pattern noise can be removed using the Smooth Sharpen | Split Frequency Spectrum tool. For details see the Compute, Display, & Remove Residual Structured Noise After Calibration and Stacking tutorial.
 |
Copyright © 2013 MLUnsold Digital Imaging. All Rights Reserved.


